How to Measure Office Occupancy Without Sensors


You already have everything you need to measure office occupancy. Your buildings generate five streams of data about who is in them: Wi-Fi connections, badge swipes, room and desk bookings, docking station connections, and headcounts. Sensorless occupancy analytics turns those into real-time, portfolio-wide occupancy data, with no hardware to buy, install or maintain.
That matters most when there is a deadline. A sensor rollout means procurement, installation and commissioning before the first useful number arrives. Your existing data goes back months, so you can analyse last year this week and have a defensible picture of attendance, utilization and peak demand before the next lease decision lands.
This guide covers what each source delivers, which metrics to calculate, and a 30-day plan to get your first reliable numbers.

Five ways to measure occupancy with data you already have
Each source answers a different question, and a modern occupancy platform ingests all of them into one view rather than leaving you with five dashboards.
1. Wi-Fi connection data
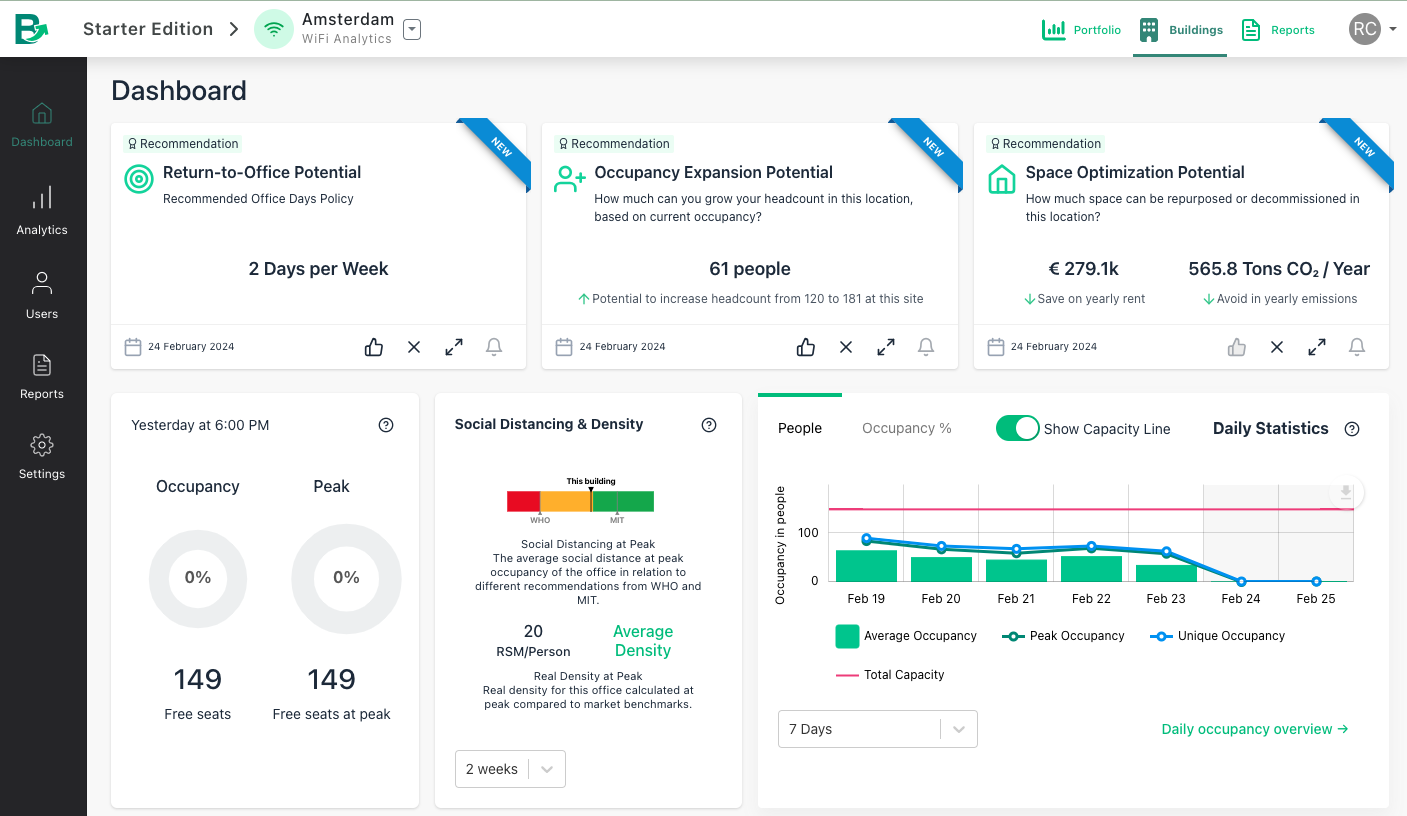
Wi-Fi is the backbone. It measures how many people are in each building, floor and zone, in real time and historically, across your entire portfolio, including the informal areas nobody books. It is the only source that covers everything from day one, which is why it anchors attendance reporting, utilization by space type and RTO compliance tracking. Converting network connections into trustworthy people counts is the engineering work: device clustering, filtering non-human devices, and per-site calibration. Our guide on using Wi-Fi data to measure occupancy covers that in detail.
2. Badge and access control data
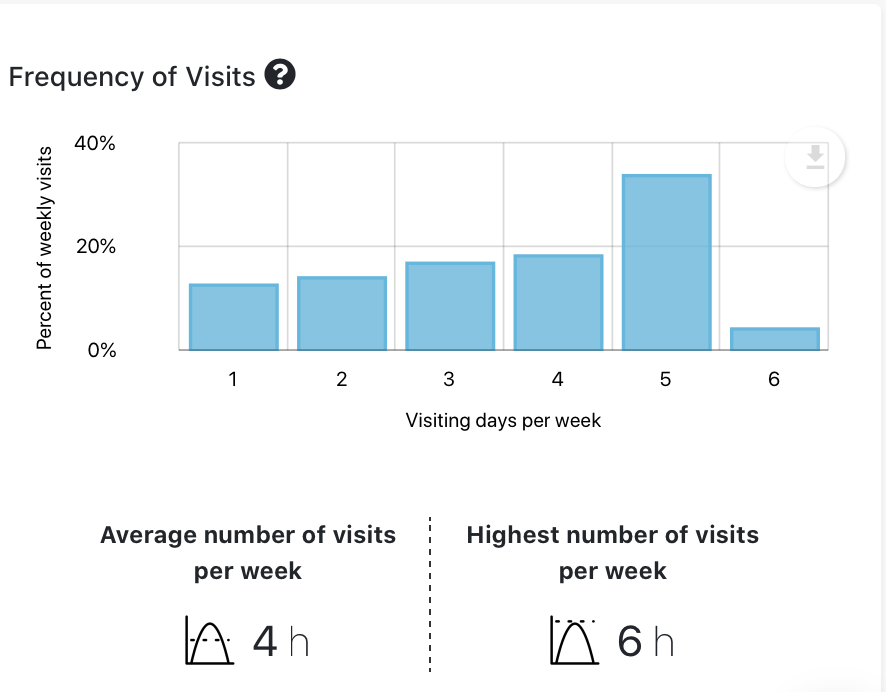
Badge data confirms who entered the building and when, which makes it the natural source for attendance and arrival patterns, and it is usually the easiest data to export. On its own it stops at the front door. Cross-checked against Wi-Fi occupancy, it becomes a validation layer that makes both sources more credible to a finance director.
3. Desk and room bookings
Booking data shows demand for bookable space, and with check-in enabled, something close to actual use. Compared against measured occupancy it exposes the single most expensive pattern in most offices: rooms booked and never used. Platforms with dedicated meeting room analytics turn that comparison into concrete recommendations on how many rooms you need and at what size.
4. Docking stations and Ethernet ports
A laptop plugged into a dock is a strong desk-level signal. Where desks are wired and mapped, this is the most precise source available without installing anything, and it pairs naturally with Wi-Fi: Wi-Fi for the whole floor, dock data for the desks on it.
5. Manual headcounts
Walking a floor and counting at fixed times gives you ground truth. You need it for a few weeks at the start, to calibrate everything else, and then rarely again. It is how accuracy is proven rather than claimed.
The combination most offices land on is Wi-Fi for continuous portfolio coverage, badge data cross-checked against it for attendance reporting, booking data for meeting rooms, and a short calibration exercise to prove the numbers. All four feed one platform, and none of them requires a purchase order for hardware.
| Data source | Coverage | Detail | Continuous? | Effort to start |
|---|---|---|---|---|
| Wi-Fi connections | Every building and floor | Building, floor, zone | Yes | Low, API access and floor mapping |
| Badge and access control | Buildings with readers | Building entry only | Yes | Low, usually a CSV export |
| Bookings with check-in | Bookable rooms and desks | Room or desk | Partly | Medium, needs a check-in policy |
| Docks and Ethernet ports | Wired desks only | Individual desk | Yes | Medium, needs port-to-desk mapping |
| Manual headcounts | Floors you walk | Room and desk | No | High per round, but no setup |
Wi-Fi is the only source that covers the whole footprint continuously, which is why it usually becomes the backbone and the others are layered on top.
Which metrics should you calculate?
Raw counts are not an answer. Five metrics turn them into something a leadership team can act on.
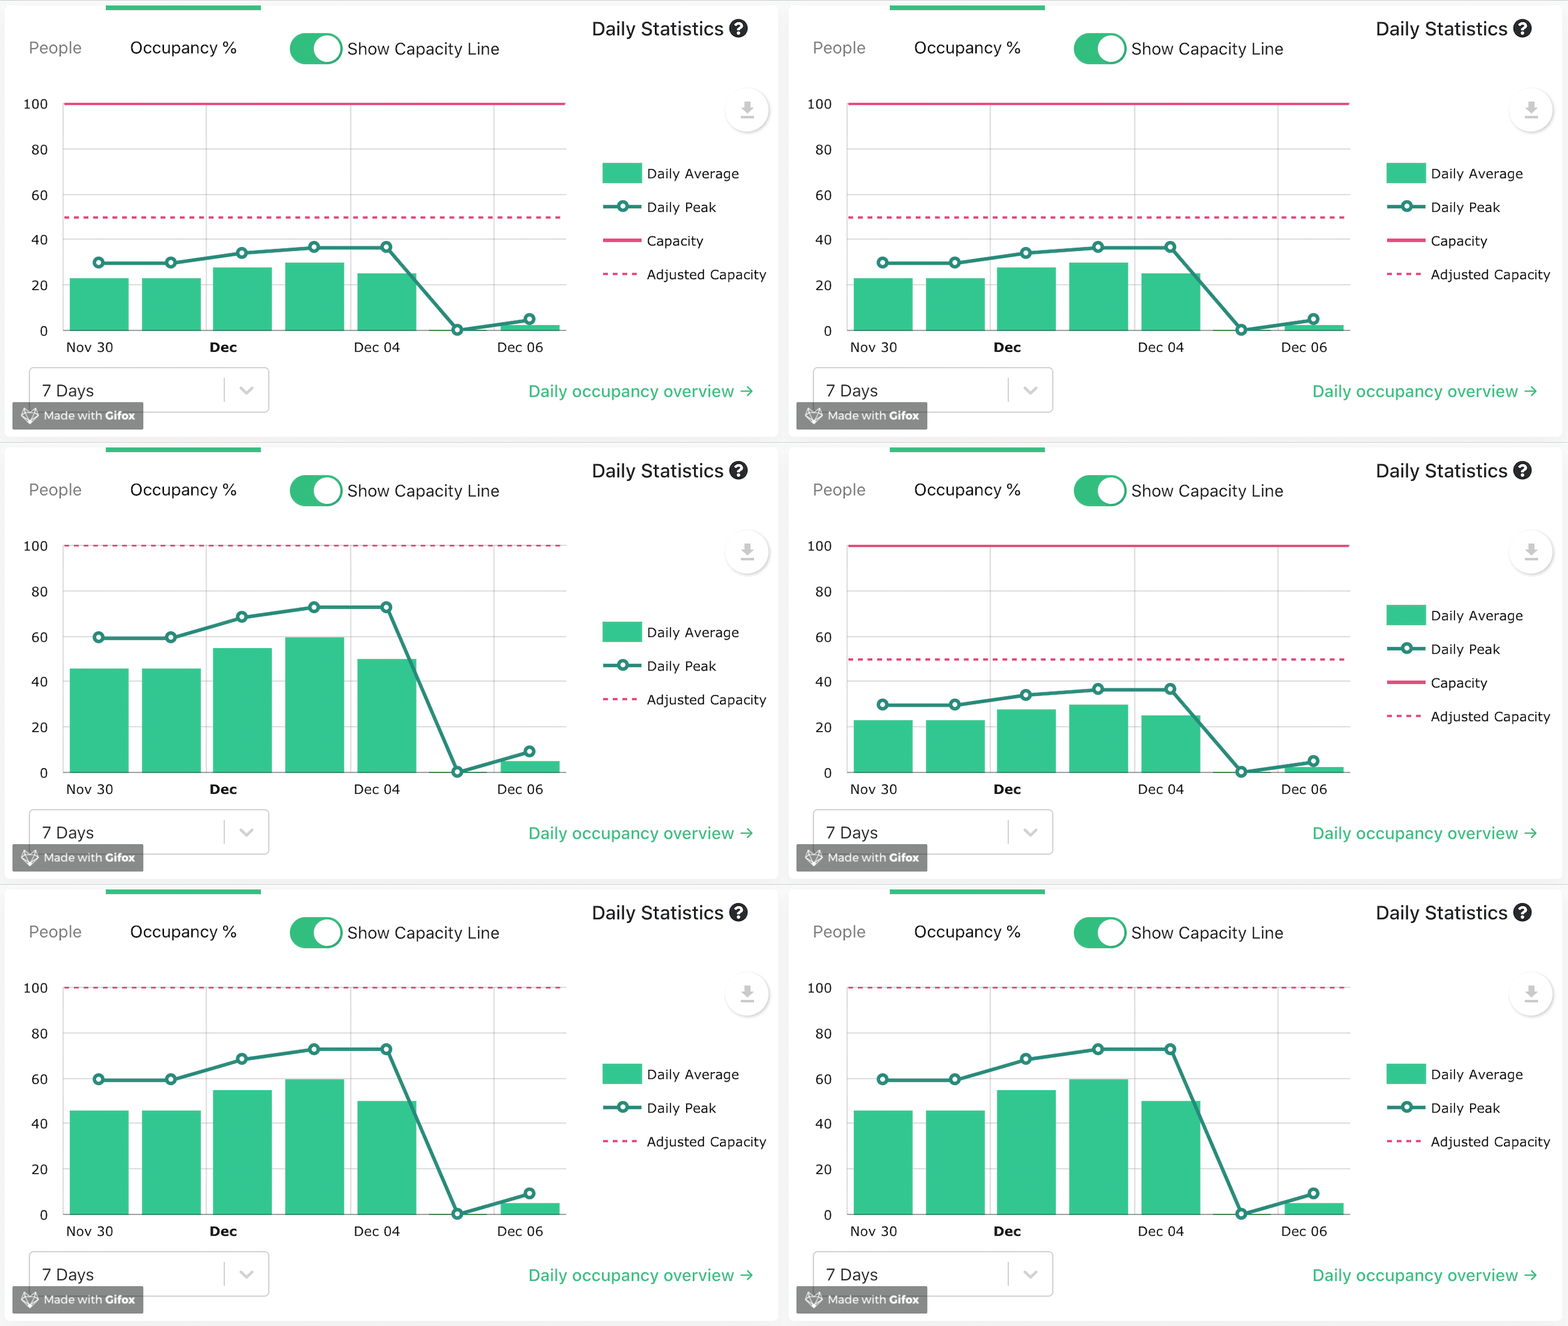
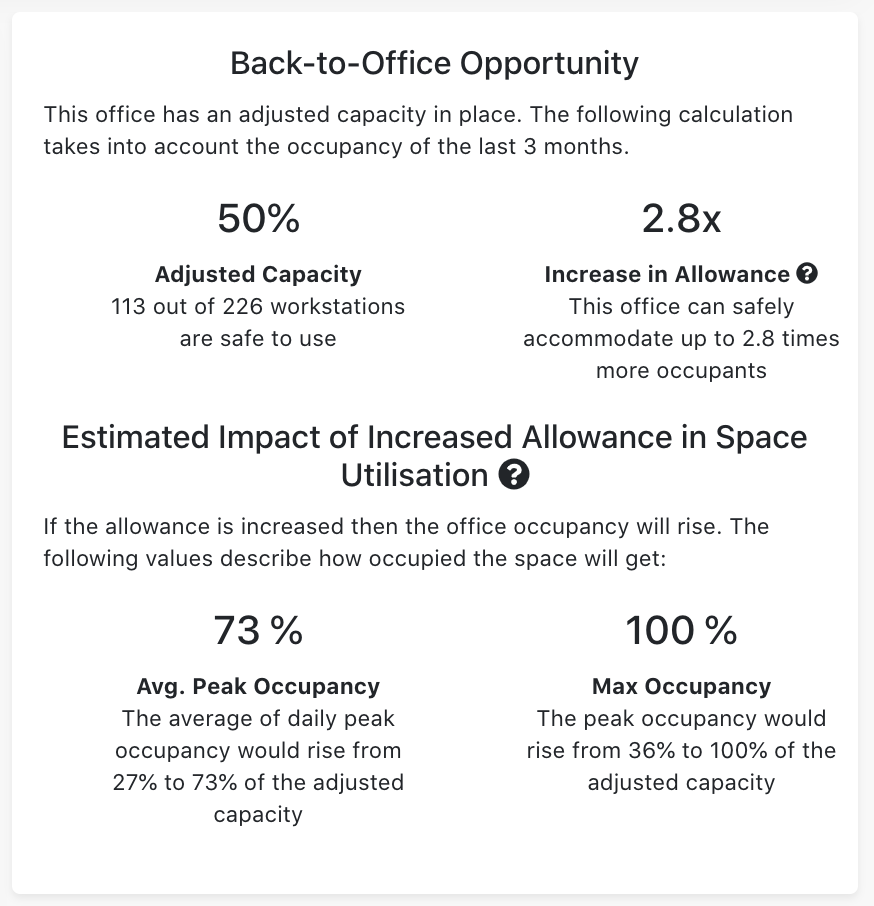
Occupancy rate is how full a space is at a given moment: people present divided by capacity. If 150 of 200 desks are in use, occupancy is 75%. Report it as an average and as a distribution, because the average hides the days that matter.
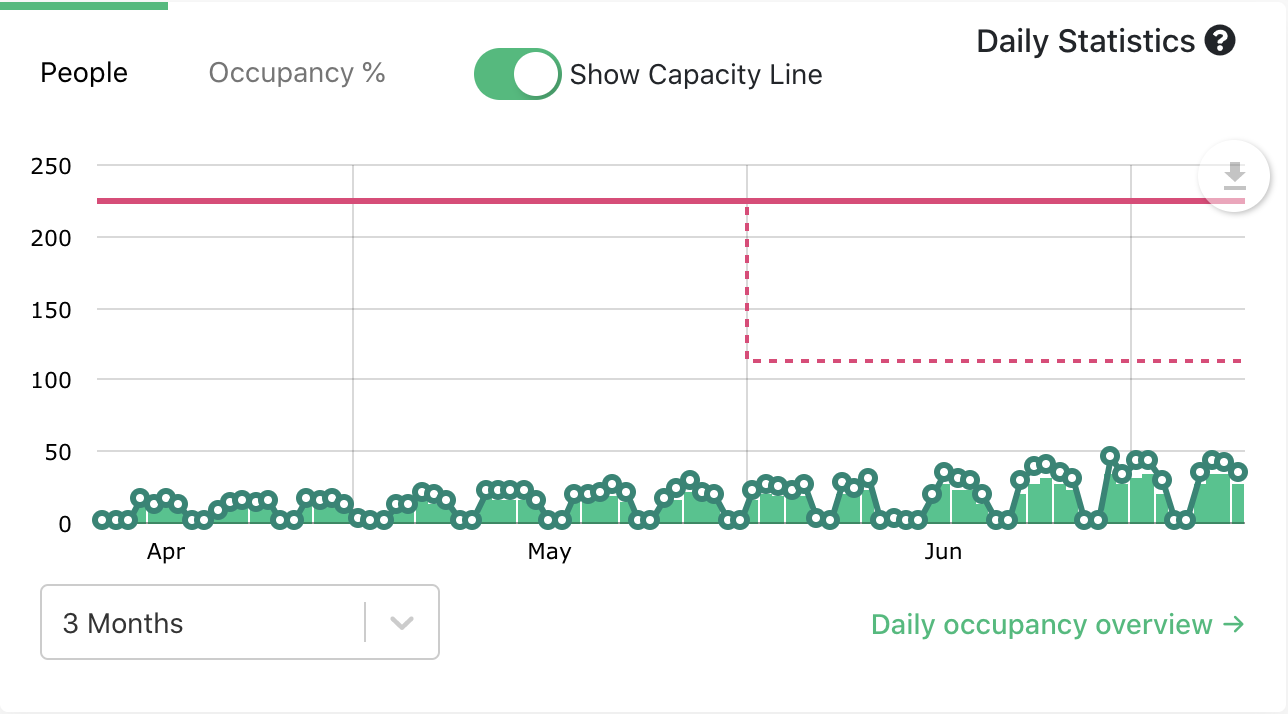
Utilization rate is how well a space is used over time, combining how often it is in use with how full it is. A floor that is 80% full on Wednesday and empty on Friday has high peak occupancy and low utilization. Utilization is the metric that drives lease and consolidation decisions.
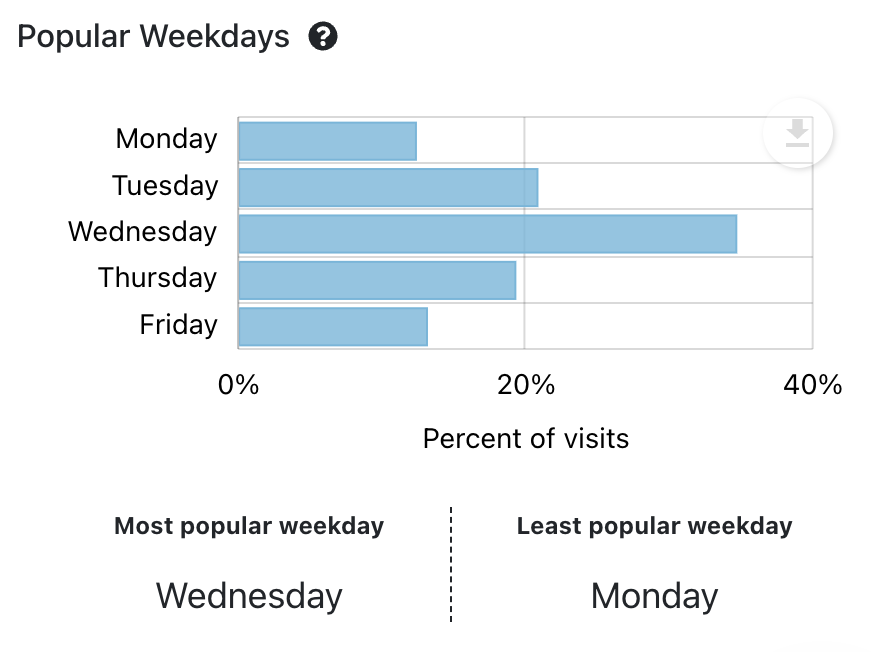
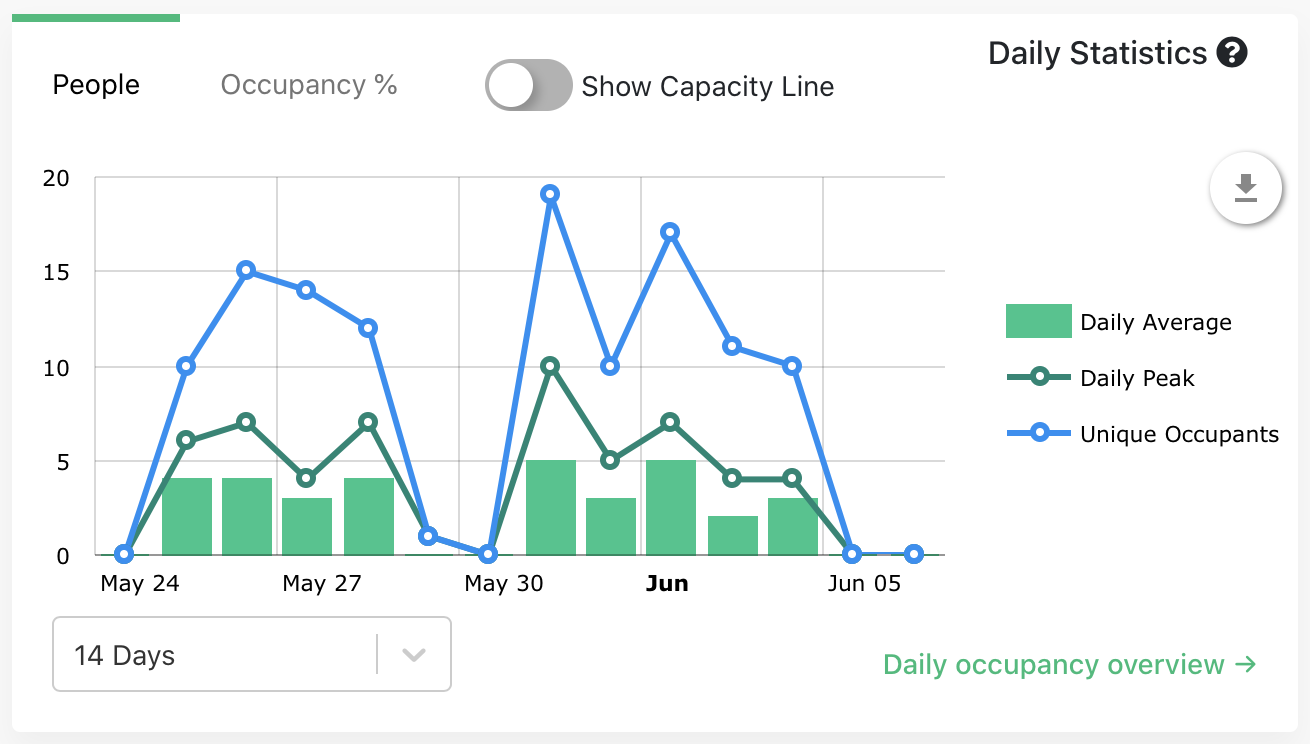
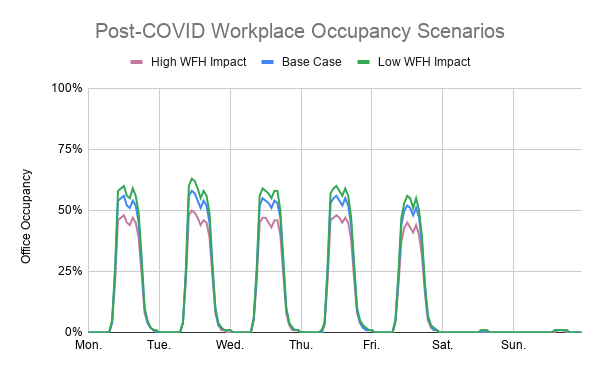
Peak occupancy is the highest demand you must still accommodate, usually Tuesday to Thursday in hybrid offices. Capacity planning follows the peak, not the average, which is why reporting only averages leads to offices that feel crowded on paper-empty days.
No-show rate is bookings that were never checked into, divided by total bookings. A high rate means your booking data is overstating demand, and it is often the fastest thing to fix.
Cost per used seat is total workplace cost divided by seats actually occupied at peak, rather than seats provided. This is the number that makes the case to a finance director, because it converts utilization into money.
For definitions and formulas across the full set of workplace measures, see our office utilization metrics guide.
A 30-day plan to get your first reliable numbers
You do not need a project team. One person with access to the right systems can do this in a month.
Week 1. Ask IT which wireless platform you run, whether access points are mapped to floors, and how long history is retained. Ask security for a badge export by day and hour, and the booking system owner for bookings and check-ins. You are inventorying data, not buying anything.
Week 2. Pick one building. Agree the standard working day you measure against, confirm real desk and room capacities, and decide which spaces are in scope. Start pulling history if it exists.
Week 3. Calibrate. Count people manually at fixed times, for example 10:00, 13:00 and 15:00 on Tuesday to Thursday, and compare with what the data says for the same moments. You want a consistent relationship, not a perfect match.
Week 4. Report attendance by day, peak occupancy by floor, utilization by space type, and the gap between booked and used. Then decide whether the picture is good enough to act on, or whether specific rooms need sensors.
Inventory the data
Wi-Fi, badge and booking exports. Check how far history goes back.
Set the ground rules
One building, one standard working day, verified capacities.
Calibrate
Manual counts at fixed times, compared with the data.
Report and decide
Attendance, peaks, utilization, and booked versus used.
Week 3 is the step most teams skip, and it is the one that makes the numbers survive scrutiny.
Where adding a sensor is worth it
The no-sensor approach covers the decisions that cost real money: lease renewals, consolidations, floor planning, RTO targets. A handful of questions benefit from a sensor in one specific room, and the right move is to add it to the same platform rather than buy a second system.
Consider one where you need live desk-level availability for a booking display, an exact headcount in a particular meeting room, counts in a space where people genuinely never connect to the network, or measurement in a workshop or production area where nobody carries a device.
Even then, sensors belong in the few rooms where the extra precision changes a decision, with network data carrying the portfolio. That keeps the hardware budget proportionate to the question, and keeps every number in one place.
Keeping it private and defensible
Measuring occupancy from data about employees raises questions that are easier to answer before the first report than after someone asks who has access.
Report spaces, not people: every output should answer how many were on floor 2 on Tuesday, never when one person arrived. Aggregate before anyone sees the data, and suppress reporting for spaces so small that a count identifies an individual. Keep raw data only as long as the analysis needs, and bring in your data protection officer, IT security, HR and, in much of continental Europe, the works council early.
Badge data deserves particular care, because it is inherently identifiable and usually collected for security purposes. Reusing it for workplace analytics is normally a new purpose under GDPR, which means its own legal basis and its own notice.
Frequently asked questions
How do you measure office occupancy without sensors?
Use the data your organisation already produces. Wi-Fi connections give real-time occupancy for every building, floor and zone; badge swipes confirm attendance; bookings with check-in cover meeting rooms; docking stations give desk-level presence; and a short round of manual counts calibrates the rest. A sensorless occupancy analytics platform combines them into one portfolio view, typically within hours of connecting.
Can you measure office occupancy for free?
Partly. Badge exports, booking reports and manual counts cost nothing but time and will show you attendance patterns and meeting room demand. Turning raw Wi-Fi logs into reliable occupancy figures is where a platform earns its place, because device clustering, non-human device filtering, floor mapping and calibration are the hard parts, and they are what make the numbers defensible.
What is the easiest way to start measuring office use?
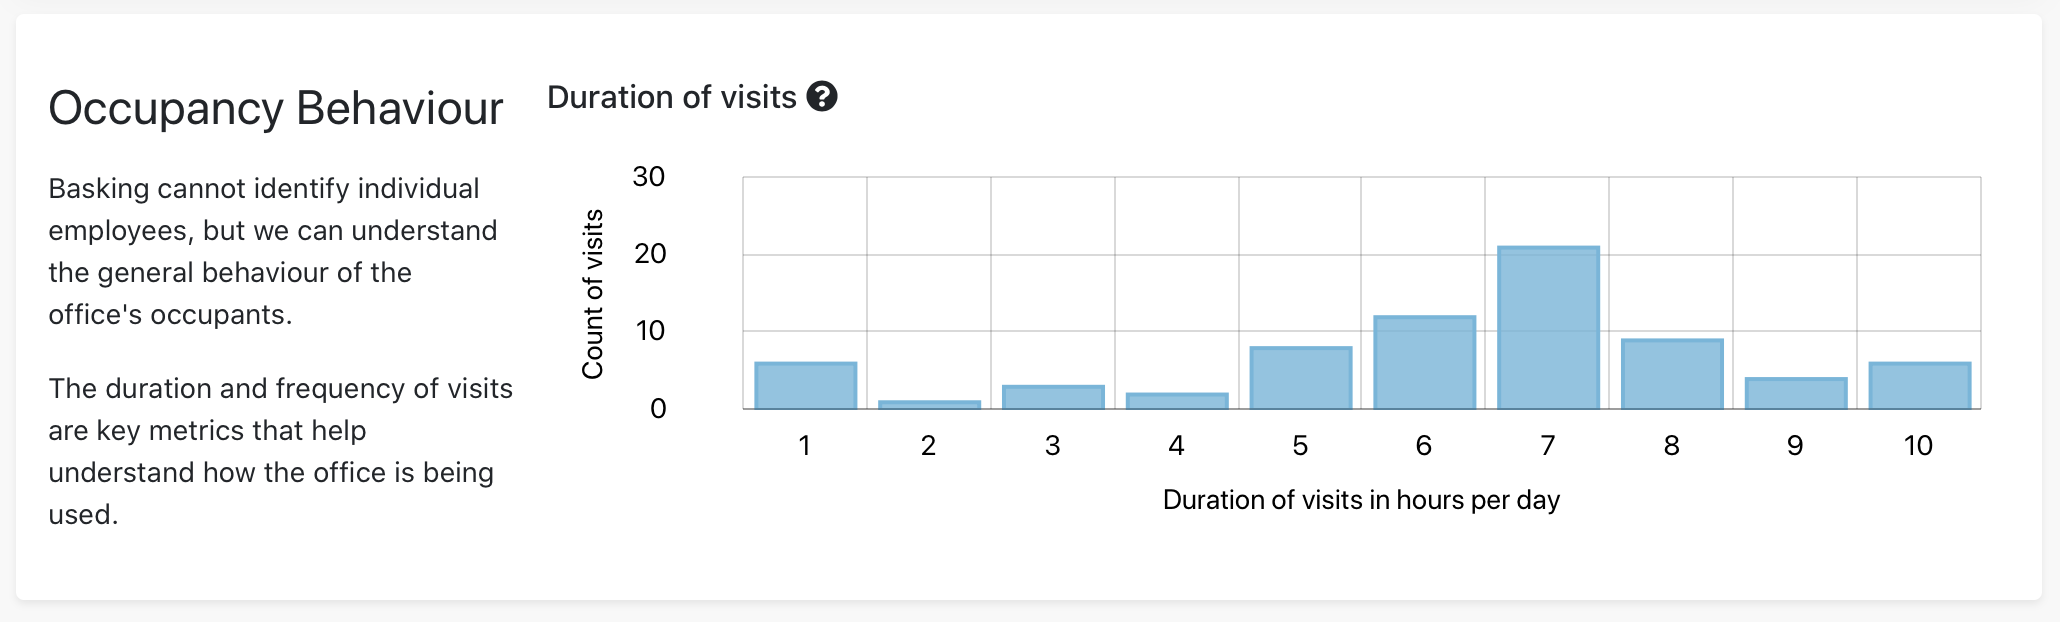
Export badge data by day and hour for the last three months. It takes an afternoon and immediately shows attendance patterns and peak days. Then add Wi-Fi data for floor-level detail, because badge data cannot show where people went.
How accurate is occupancy data without sensors?
Accurate enough to base lease and consolidation decisions on. Enterprise platforms establish accuracy through a calibration phase against badge records or manual counts when a site connects, then monitor it continuously. Accuracy is strongest at building, floor and zone level, and a second source is added where seat-level certainty is required.
How long does it take to get usable occupancy data?
Weeks rather than months, because the data already exists. If your systems retain history, you may be able to analyse the past six months immediately. A sensor deployment of the same scope typically takes a quarter or more before the first full season of data.
What is the difference between occupancy and utilization?
Occupancy is how many people are present at a moment in time. Utilization measures how well a space is used over a period, combining how often it is in use with how full it is. A room can be at full occupancy for one hour a week and still have very low utilization.
Can badge data alone measure office occupancy?
Badge data is excellent for attendance trends and return-to-office reporting, and it is usually the quickest export to get. For anything beyond the front door, which floors people used and how long they stayed, pair it with Wi-Fi occupancy data. The two together are stronger than either alone, because each validates the other.
Do booking systems show real occupancy?
Only with enforced check-in. Without it, bookings record intent rather than presence, and no-shows are common enough in most offices that booking data overstates real demand. Adding a check-in step with automatic release of unclaimed bookings turns booking data into a far better proxy for real use, and the no-show rate itself becomes a useful metric.
Final thoughts
The most common reason workplace teams have no occupancy data is not that sensors are expensive. It is that measurement feels like a project, so it never starts. In practice the first useful numbers come from exports you can request this week, and a sensorless platform can be reading your network within hours.
Start with what you already have, prove it with a few hours of manual counting, and add hardware only where a specific question demands it.
Basking occupancy analytics
Occupancy data without buying hardware
Basking combines your existing Wi-Fi, badge and booking data into one view of how every building is used, so you can see underused floors before the next lease decision.