2022: A Strong Foundation for What’s Ahead


With 2023 off to a fast start, we are looking forward to a strong year building on the momentum of 2022. With a number of important product updates, last year saw the Basking Occupancy Analytics platform evolve in several key areas, particularly expanded reporting/analytics capabilities, improved UI/UX, and more diverse integration options. This foundation and ensuing roadmap reinforce Basking’s commitment to delivering better occupancy analytics in a better way.
Headlining the updates were mission-critical features supporting the hybrid work/return-to-office balance, including:
In-App Goal-Based Reporting
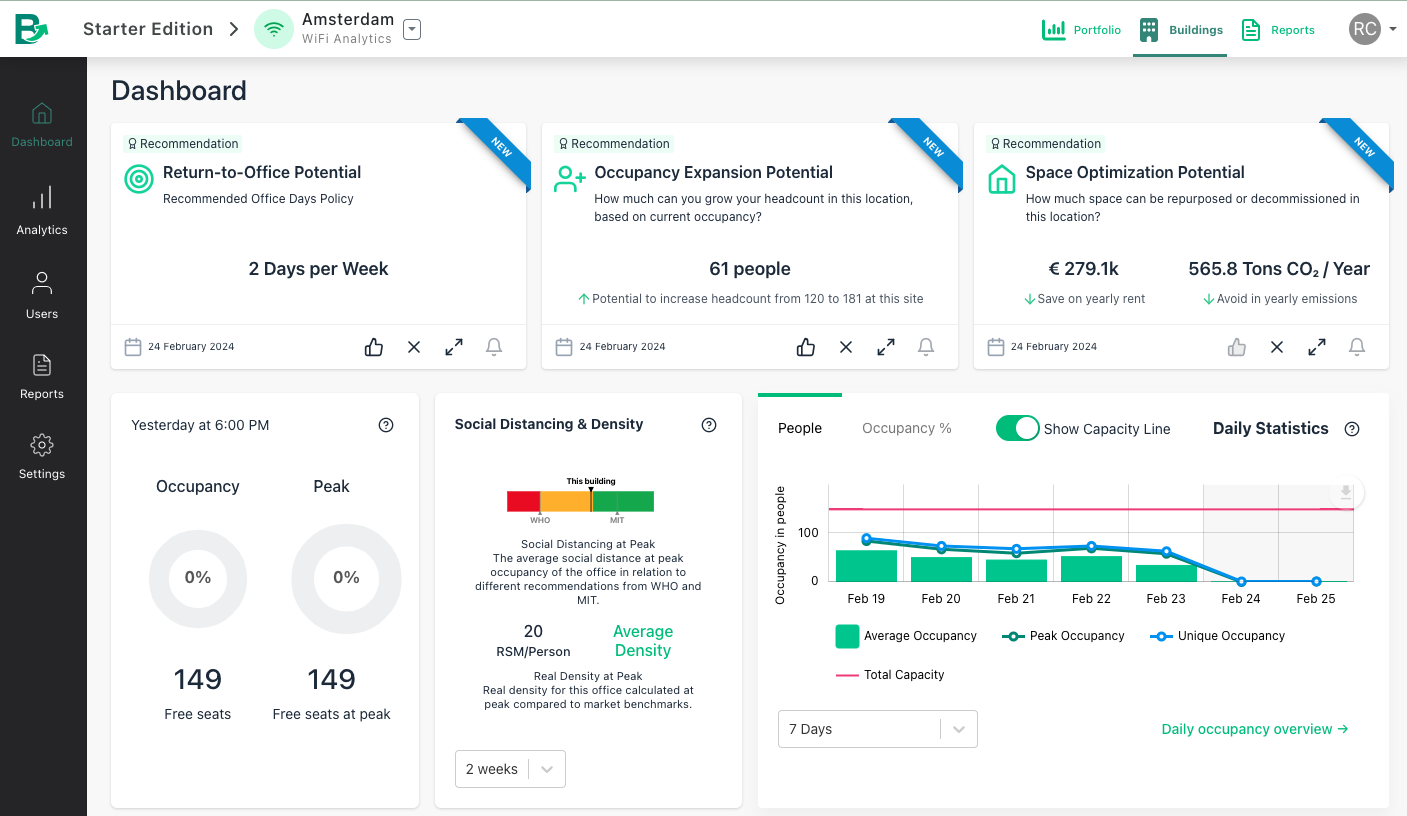
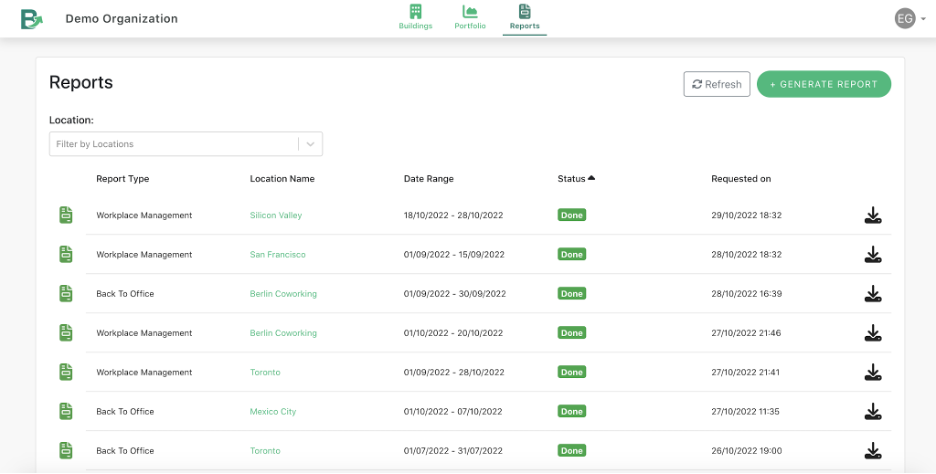 Users can now seamlessly generate and deliver world-class CRE analytics reports with this in-app reporting functionality. Go beyond data dashboards to understand the opportunities for your sites within minutes and share at a moment’s notice with presentation-ready reporting.
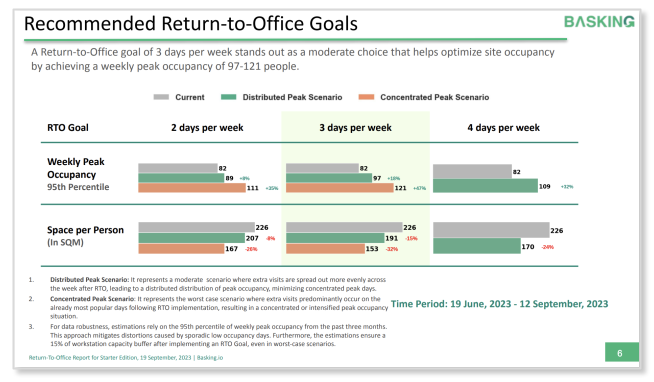
These reports are tailored to specific CRE goals, offering users ready access to occupancy reports and insights targeted to their individual needs. A highly requested user feature, the goal-based reporting launched with two high-priority areas of focus—RTO potential with Back to Office, and general trends and optimization opportunities by site with Workplace Management.
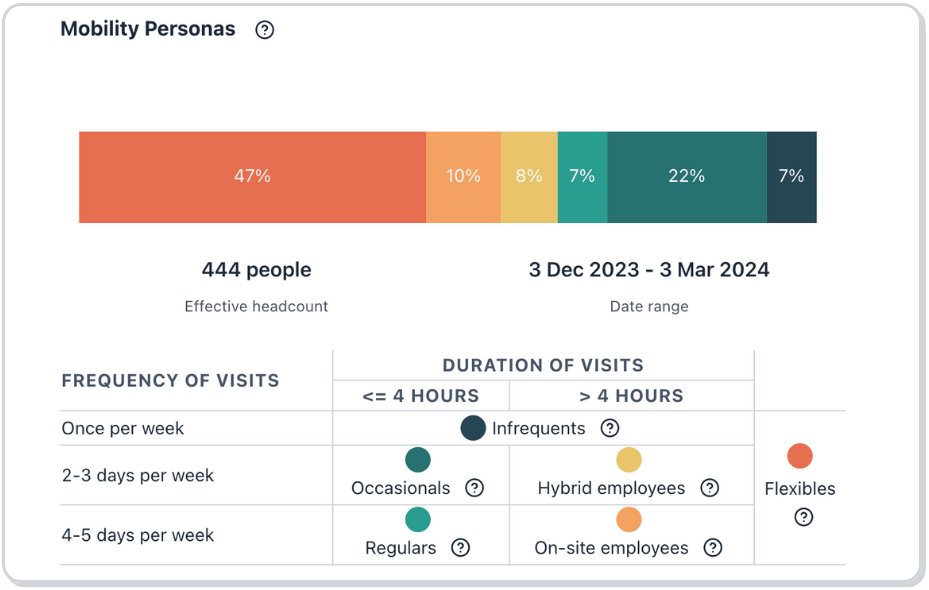
Duration and Frequency of Visits
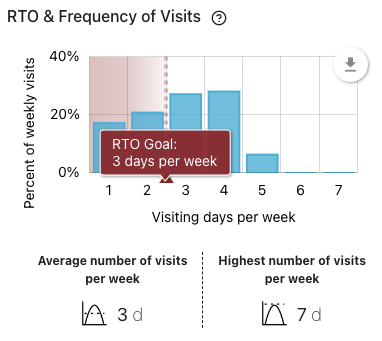
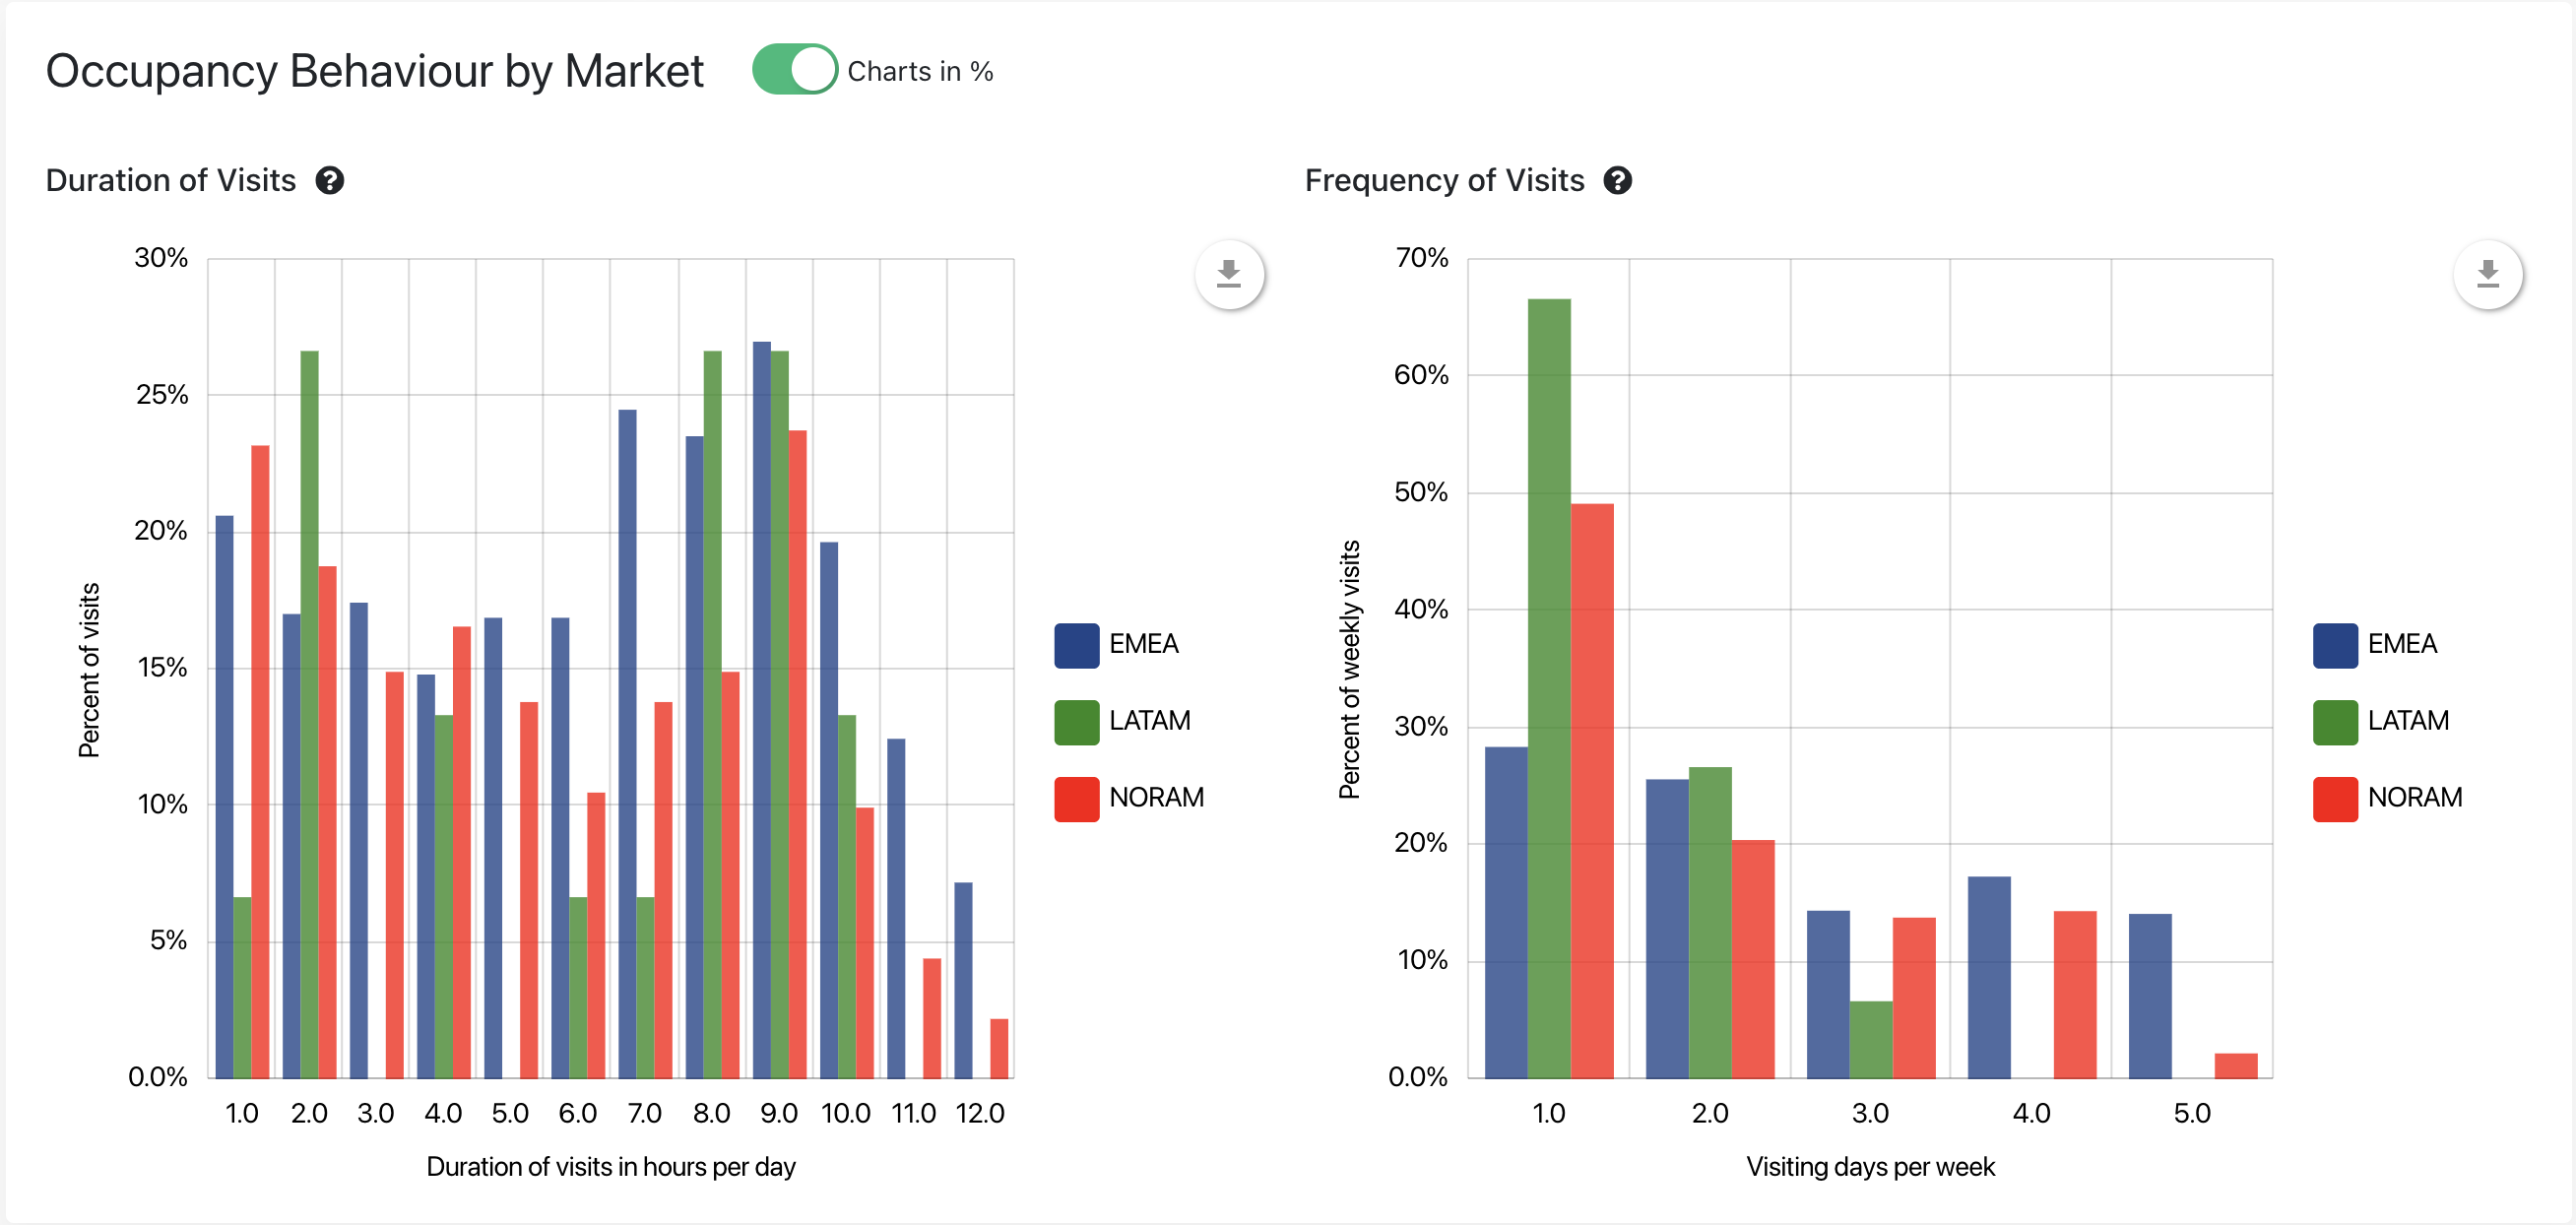
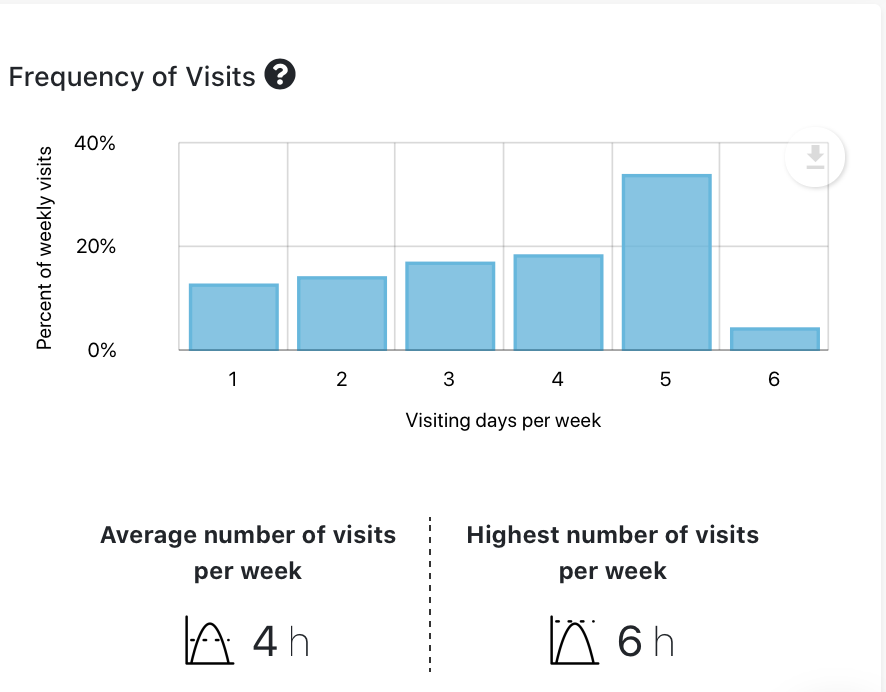
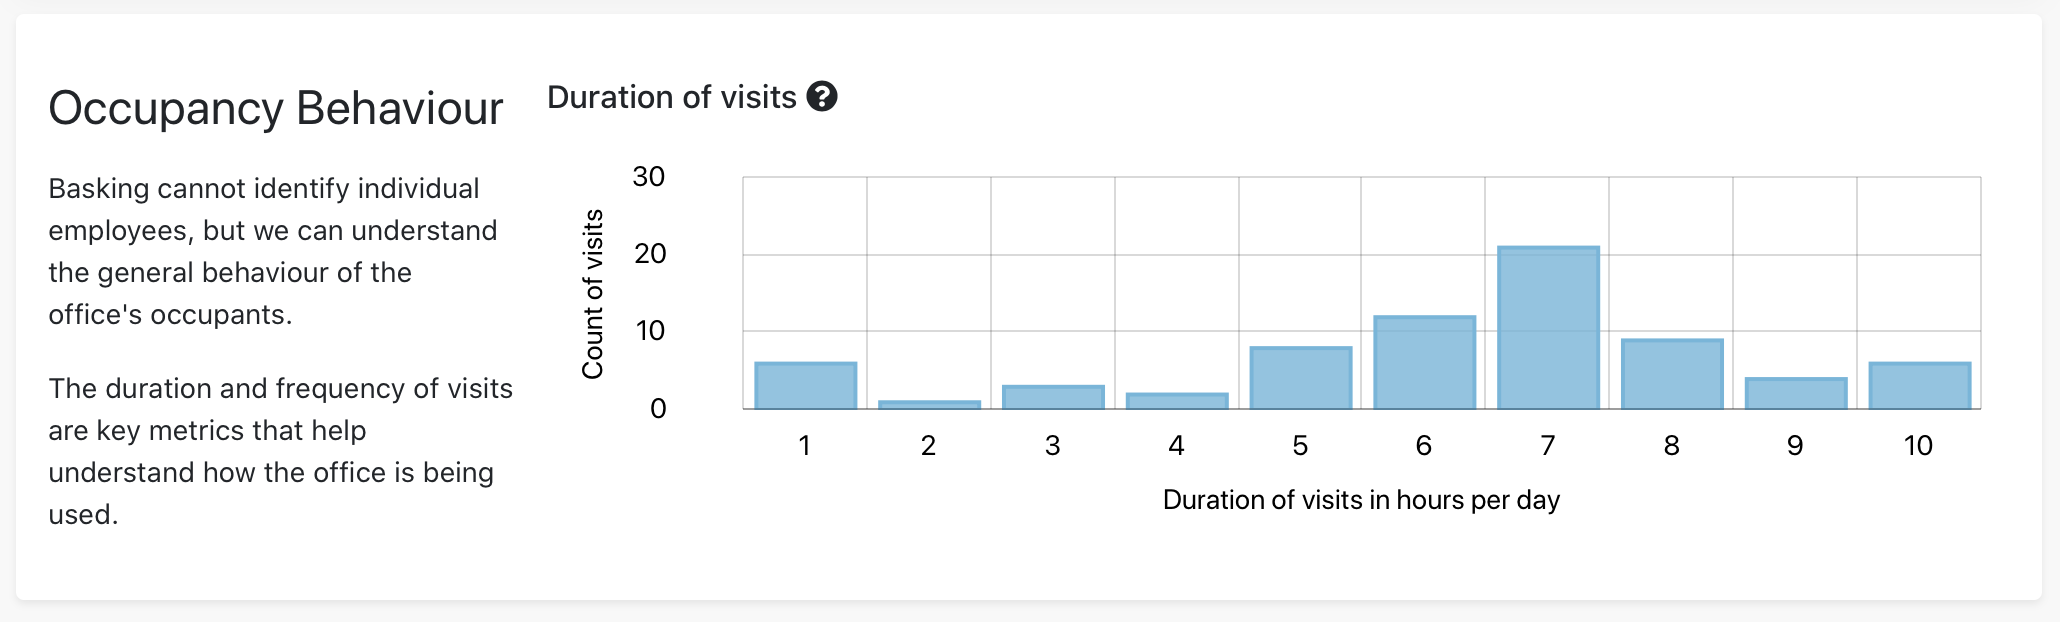
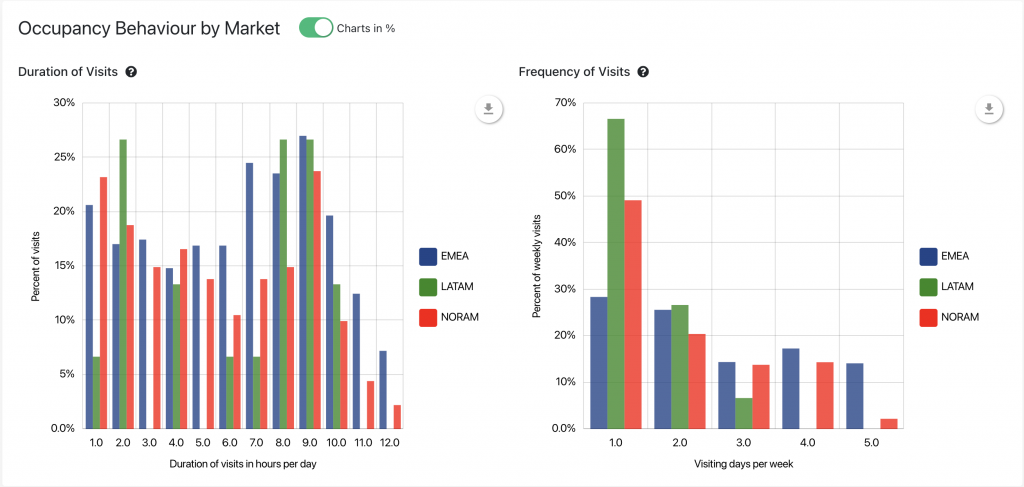 By analyzing both the duration of visits and the frequency at the site level, this feature helps real estate and workplace managers understand how individual offices are being used day to day. Expanding that metric to the portfolio level, users can aggregate by regions, giving insights on employee and office utilization at a more macro level across different regions.
Users tasked with creating, adjusting, or monitoring workplace policies and resource utilization can leverage this data to generate critical insight and reconcile discrepancies.
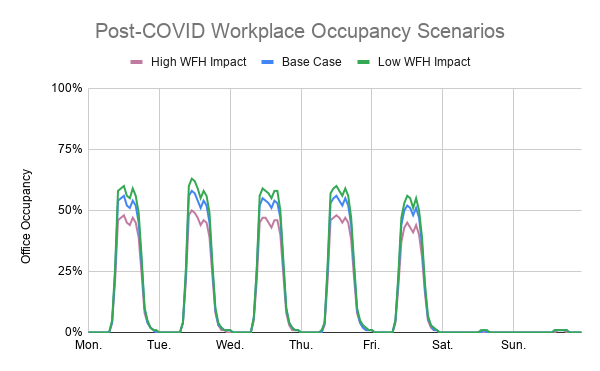
Popular Weekdays
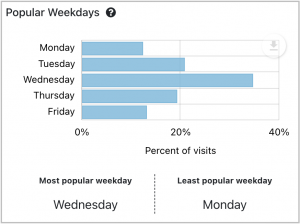 This important behavioral metric looks at which day of the week is most visited by employees of an office. When used in combination with Frequency and Duration of Visits, the resulting insight allows users to see the full picture of hybrid work adoption at a particular office or offices track the progress over time.
Further showcasing the platform’s fluidity, additional updates spanned a number of use cases and organizational priorities:
REPORTING
-
-
Flexible Workplace Adoption Report
-
By identifying the most and least utilized areas at your site, this report highlights opportunities for area-level optimization to enhance your employees’ productivity and experience. Additionally, the report can be utilized by Facility Management to adjust cleaning schedules, supply allocation, and operational or maintenance needs.
-
-
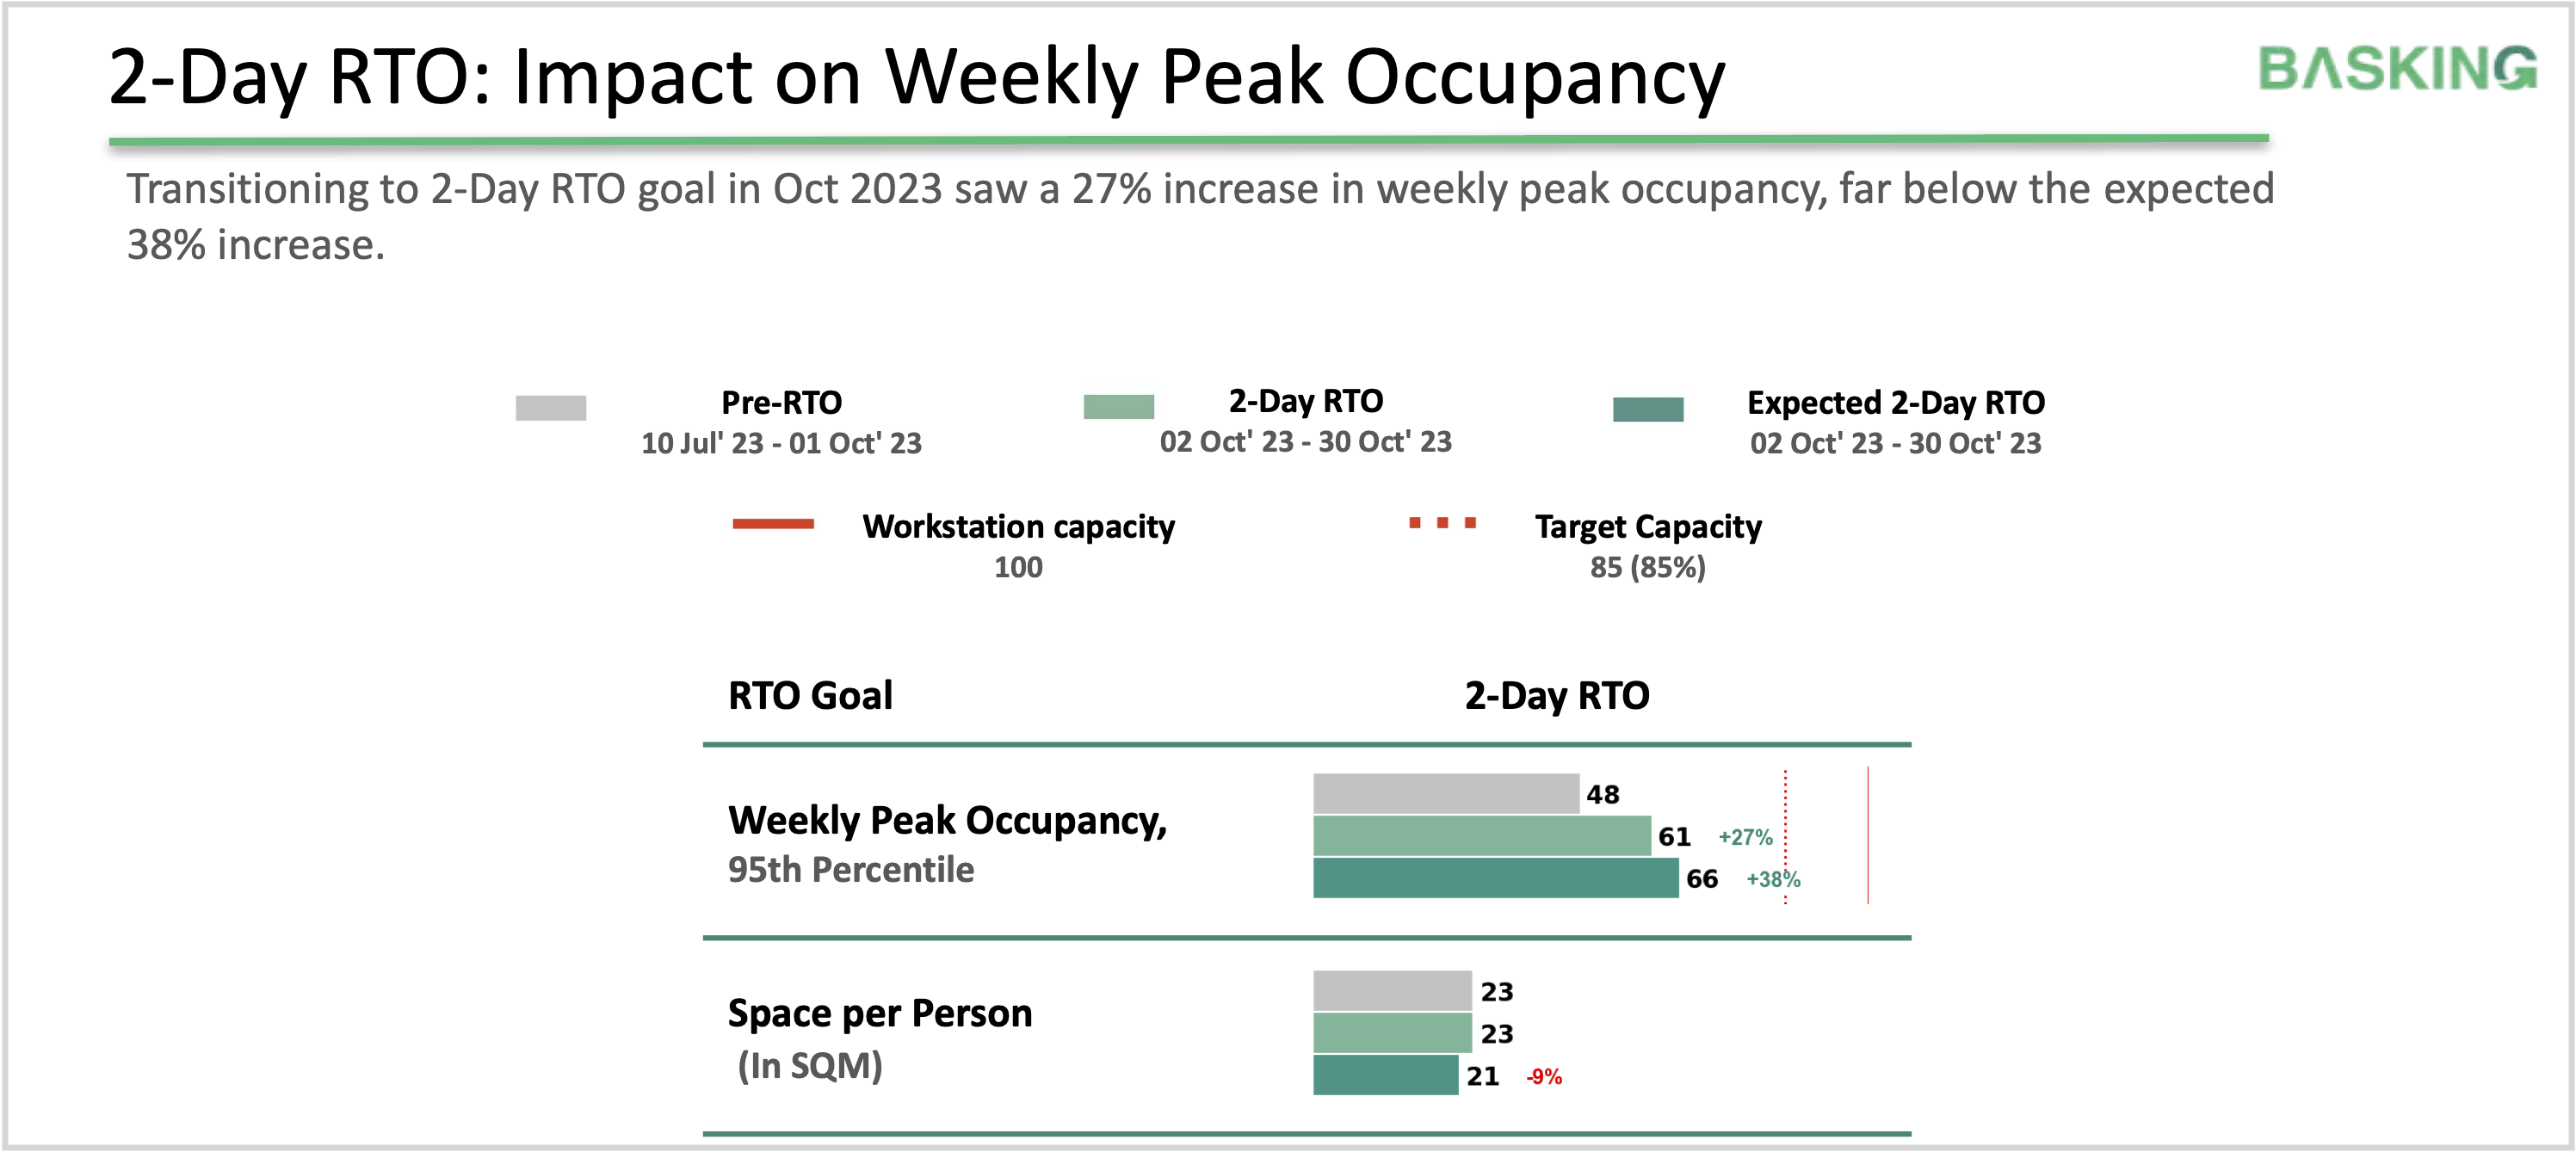
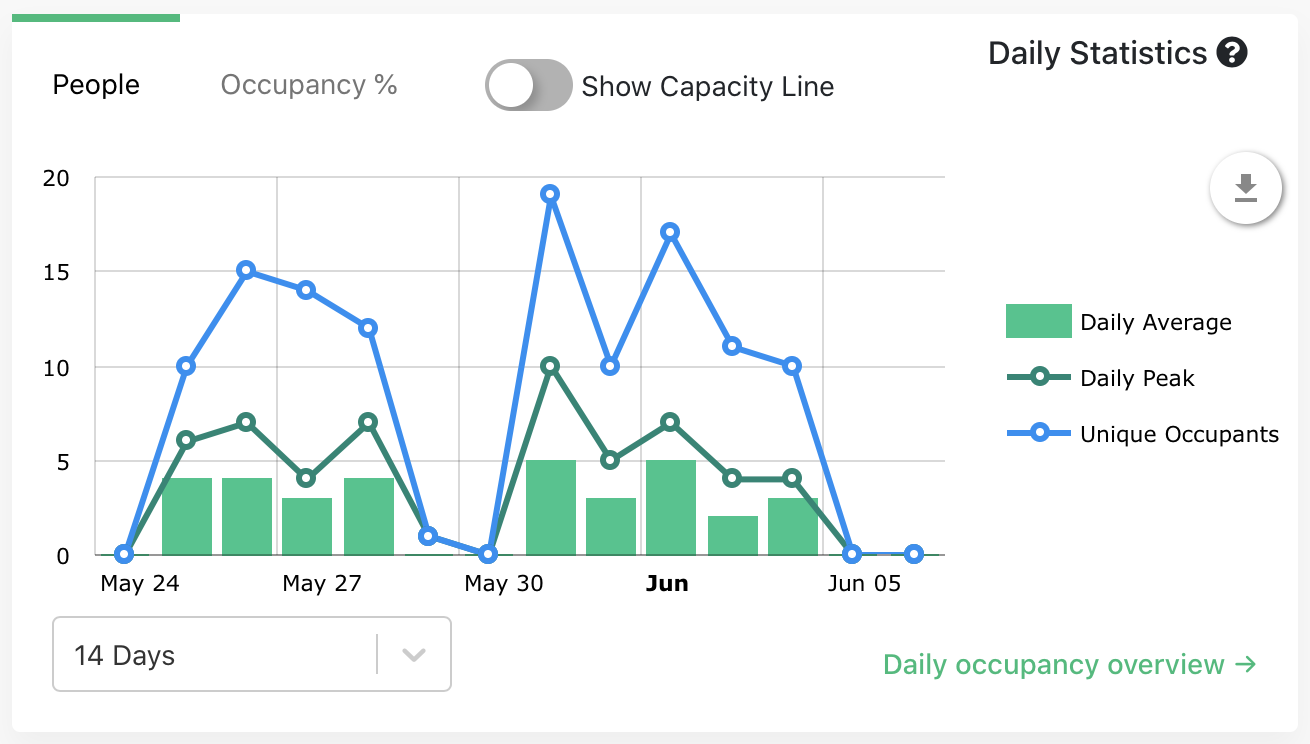
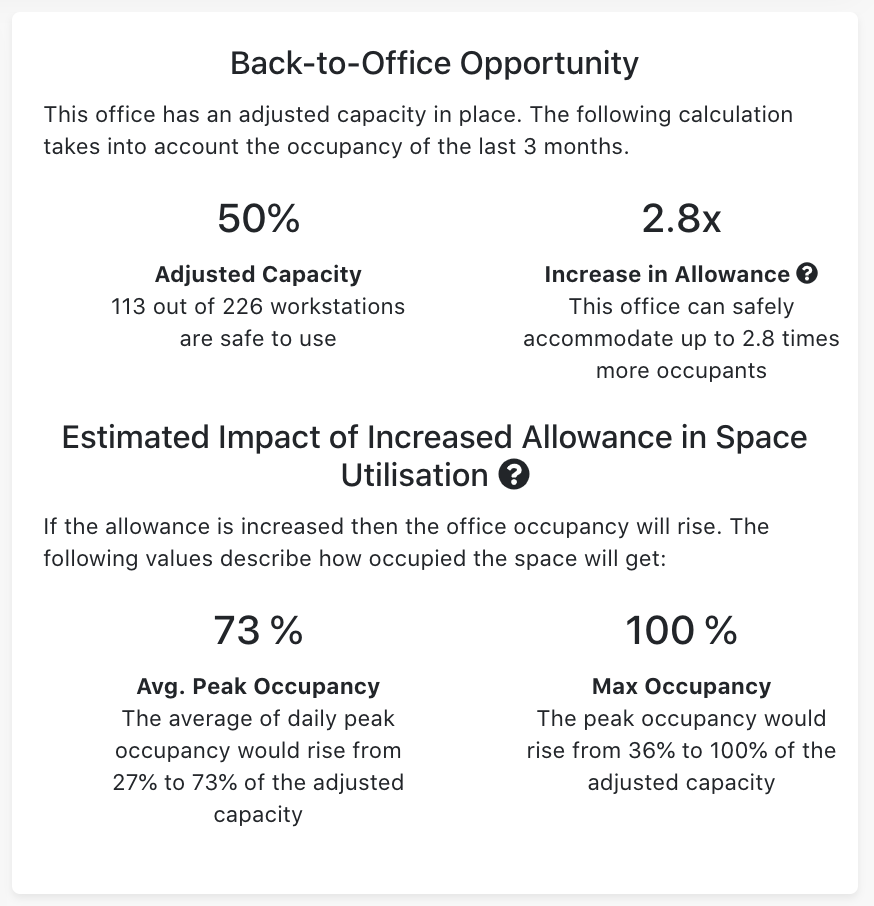
Back-to-Office Report
-
A custom report option for clients interested in understanding how RTO processes can be managed to reduce the risks of overcrowding and maximize the impact of internal policies. This monthly PDF report is automatically delivered to these users, ensuring regular insight into the Back-to-Office Opportunity (staff allocation), occupancy peaks, and overcrowded spaces.
UI/UX
-
-
Minimum Duration Filter
-
By defining a minimum duration, this new setting allows users to filter out short visits in the office to account for visitors or other usage irrelevant to overall trends. It is configurable for each location to account for variances in site usage and ensure flexibility and accuracy across a portfolio.
-
-
Ranking Sites by Occupancy
-
Real estate management dashboards now include a new card for portfolio users, ranking their sites by utilization. Users can choose to rank by either peak or average occupancy to highlight the most underutilized and most overutilized sites in their portfolio.
Additional ranking filters provide further analysis of site utilization, including absolute occupancy numbers or occupancy relative to site capacity. Sites are color-coded to market location to facilitate ease-of-use and rapid comprehension.
-
-
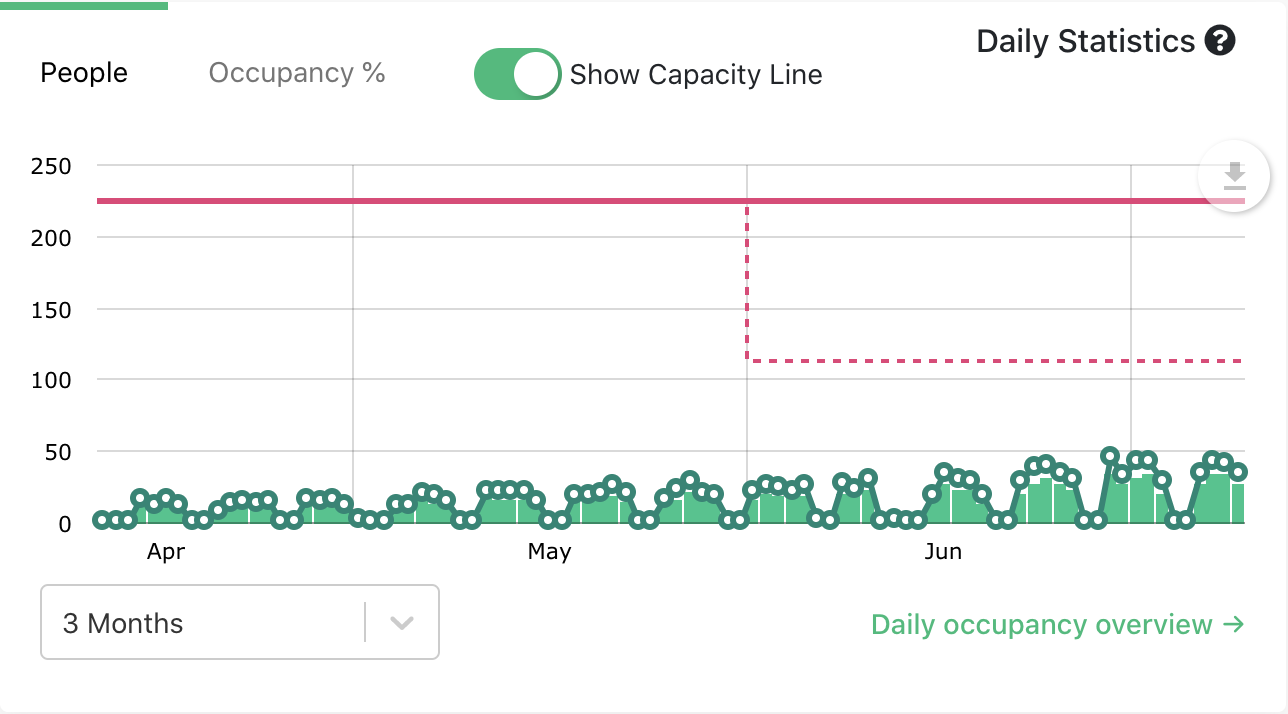
Capacity in Seats
-
A small but significant change in understanding this metric, “Capacity in Workstations” has been recast as “Capacity in Seats.” This more flexible wording can accommodate different scenarios in preparation for tracking multiple capacity metrics, and can mean both workstation seats and total office seats.
TECHNICAL
-
-
Juniper Mist Integration
-
 A simple integration process with one of the leading enterprise cloud-based network management solutions allows us to easily onboard new sites running on Juniper Mist. Let us know if you would like us to talk with your IT team and walk through how quickly this integration can be implemented.
Stay tuned to hear more about what’s in store for occupancy analytics in 2023!