Q1 2023 Global Occupancy Benchmarks | Flexibility in Flux Navigating the Evolving Workplace Landscape


Has the Return to Office movement peaked, or are there still surprises in store? Predictability has been in short supply for the CRE industry among changing worker expectations, highly publicized layoffs, and lingering economic questions, but portfolios still need to be managed and business strategies implemented.
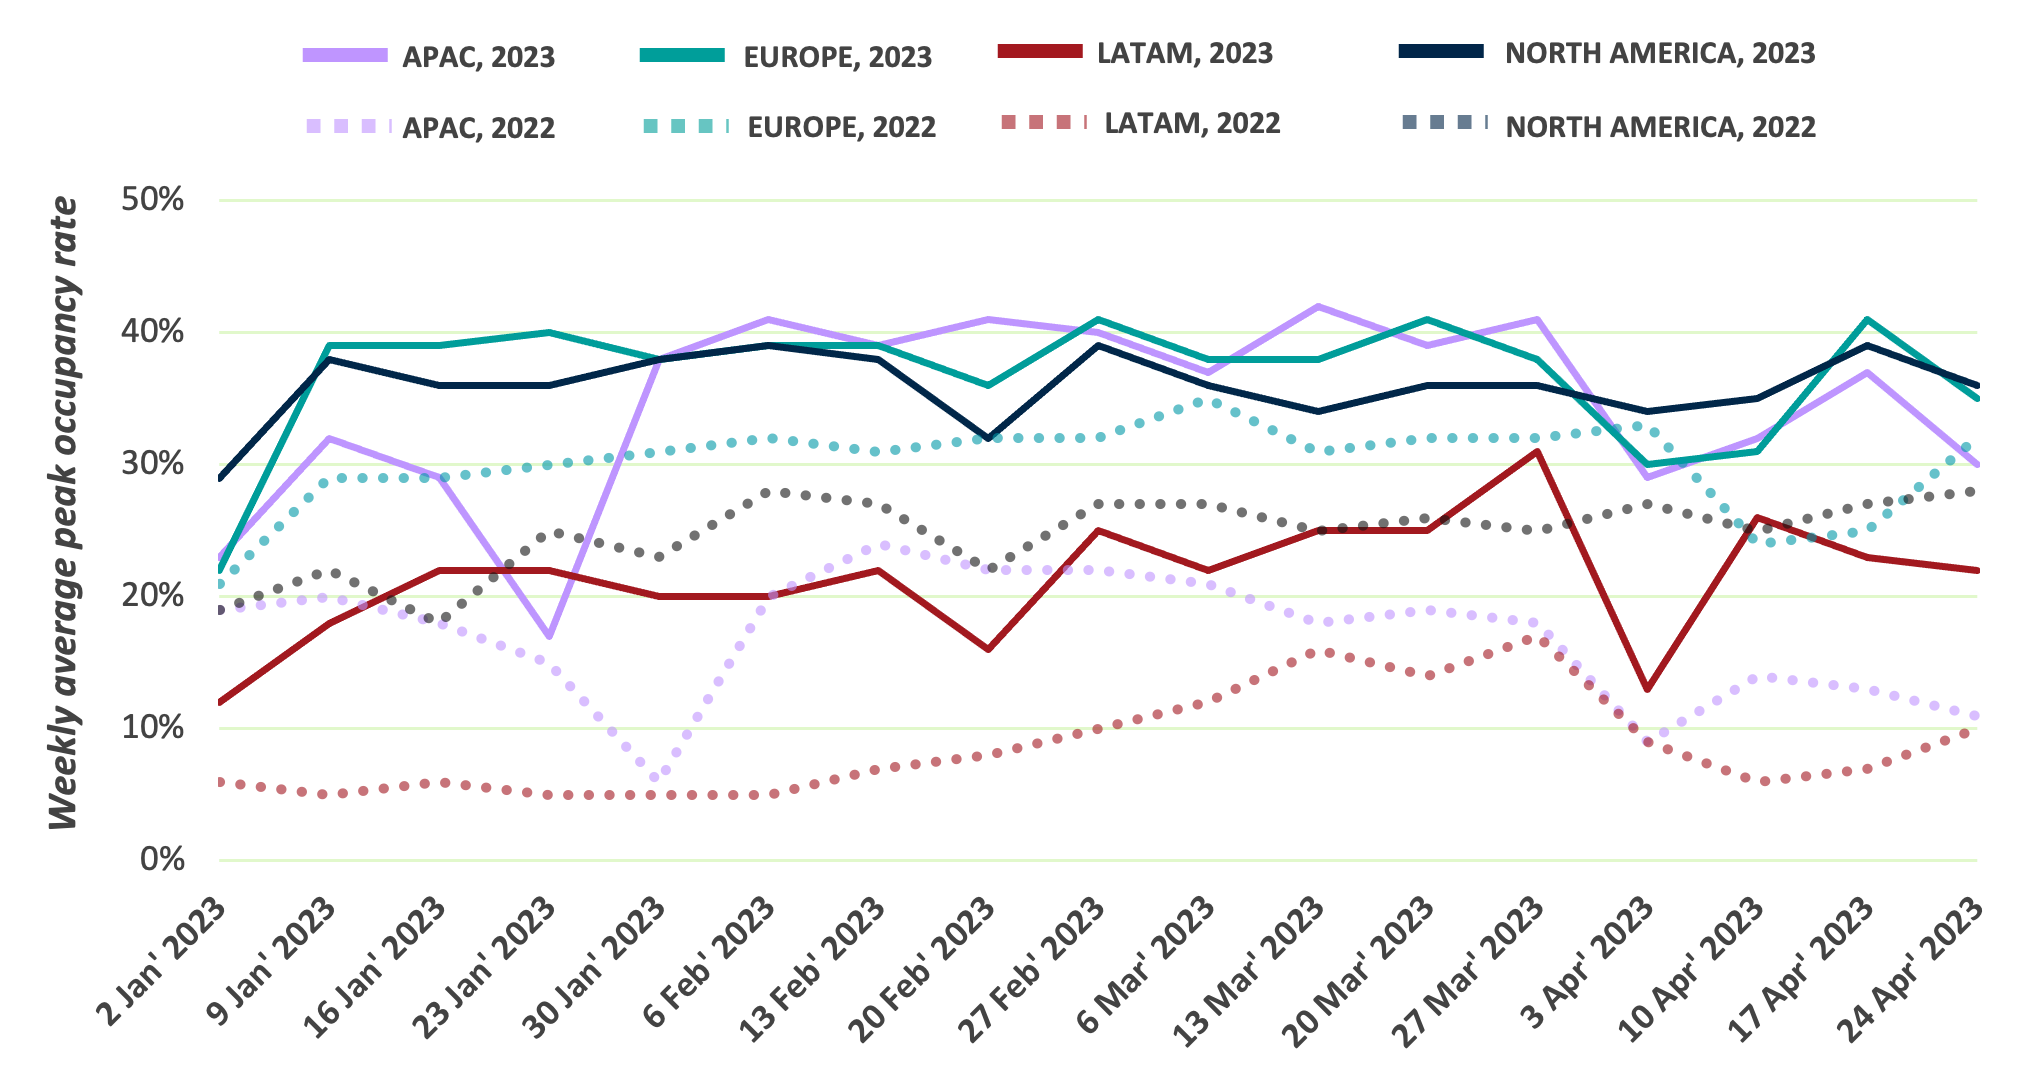
As the industry leader in real-time occupancy analytics, we are committed to providing the most up-to-date global occupancy benchmarks and insights throughout the year to guide effective CRE strategies for organizations worldwide. Some of these trends reflect a degree of continuity, but there is also a surprising variability that confirms a flexibility in flux—while LATAM demonstrated the lowest weekly average peak occupancy of any region at 21%, that is a YOY growth of 130%+ compared to the same period in 2022.
In comparing and studying office utilization trends across our portfolio for January through April, we have documented quarter-over-quarter occupancy behavior metrics including the duration, frequency and weekdays for office visits. We have also expanded the list of offices to 120+ to better capture the scale and nuance of the data, both globally and within regions.
KEY FINDINGS
- Return to Office has not yet peaked but there are indications of a more nuanced and optimistic outlook regarding office utilization trends
- Weekly occupancy rates are increasing, surpassing 40% in multiple regions—the highest since 2022
- Companies are responding to the changing needs and expectations of employees, resulting in a significant shift in the workplace environment
- Peak office usage is consistently highest in midweek, highlighting the potential for optimization and conservation as organizations adapt to these dynamic occupancy trends
- The continued adoption of hybrid work in 2023 highlights the evolution of office occupancy trends globally and the urgency of utilization data in supporting overall business strategies
+40% WEEKLY OCCUPANCY RATE HIGHEST SINCE 2022
From January to April 2023, both Europe and APAC had weeks where their occupancy rates exceeded 40%, the highest since 2022. On average, Europe maintained a 37% occupancy rate during this period, while North America and APAC followed closely behind at 36% and 35% respectively. In comparison, LATAM reached a peak occupancy rate of 21%.
All regions experienced a significant increase compared to the same period in 2022, with LATAM seeing the largest increase of 133% YOY.
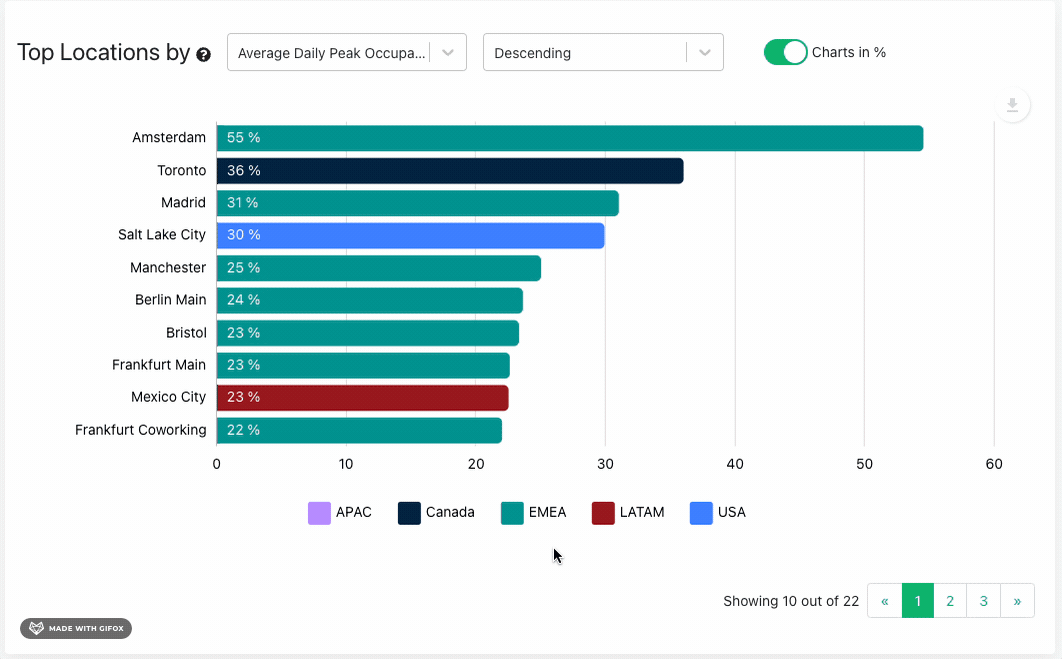
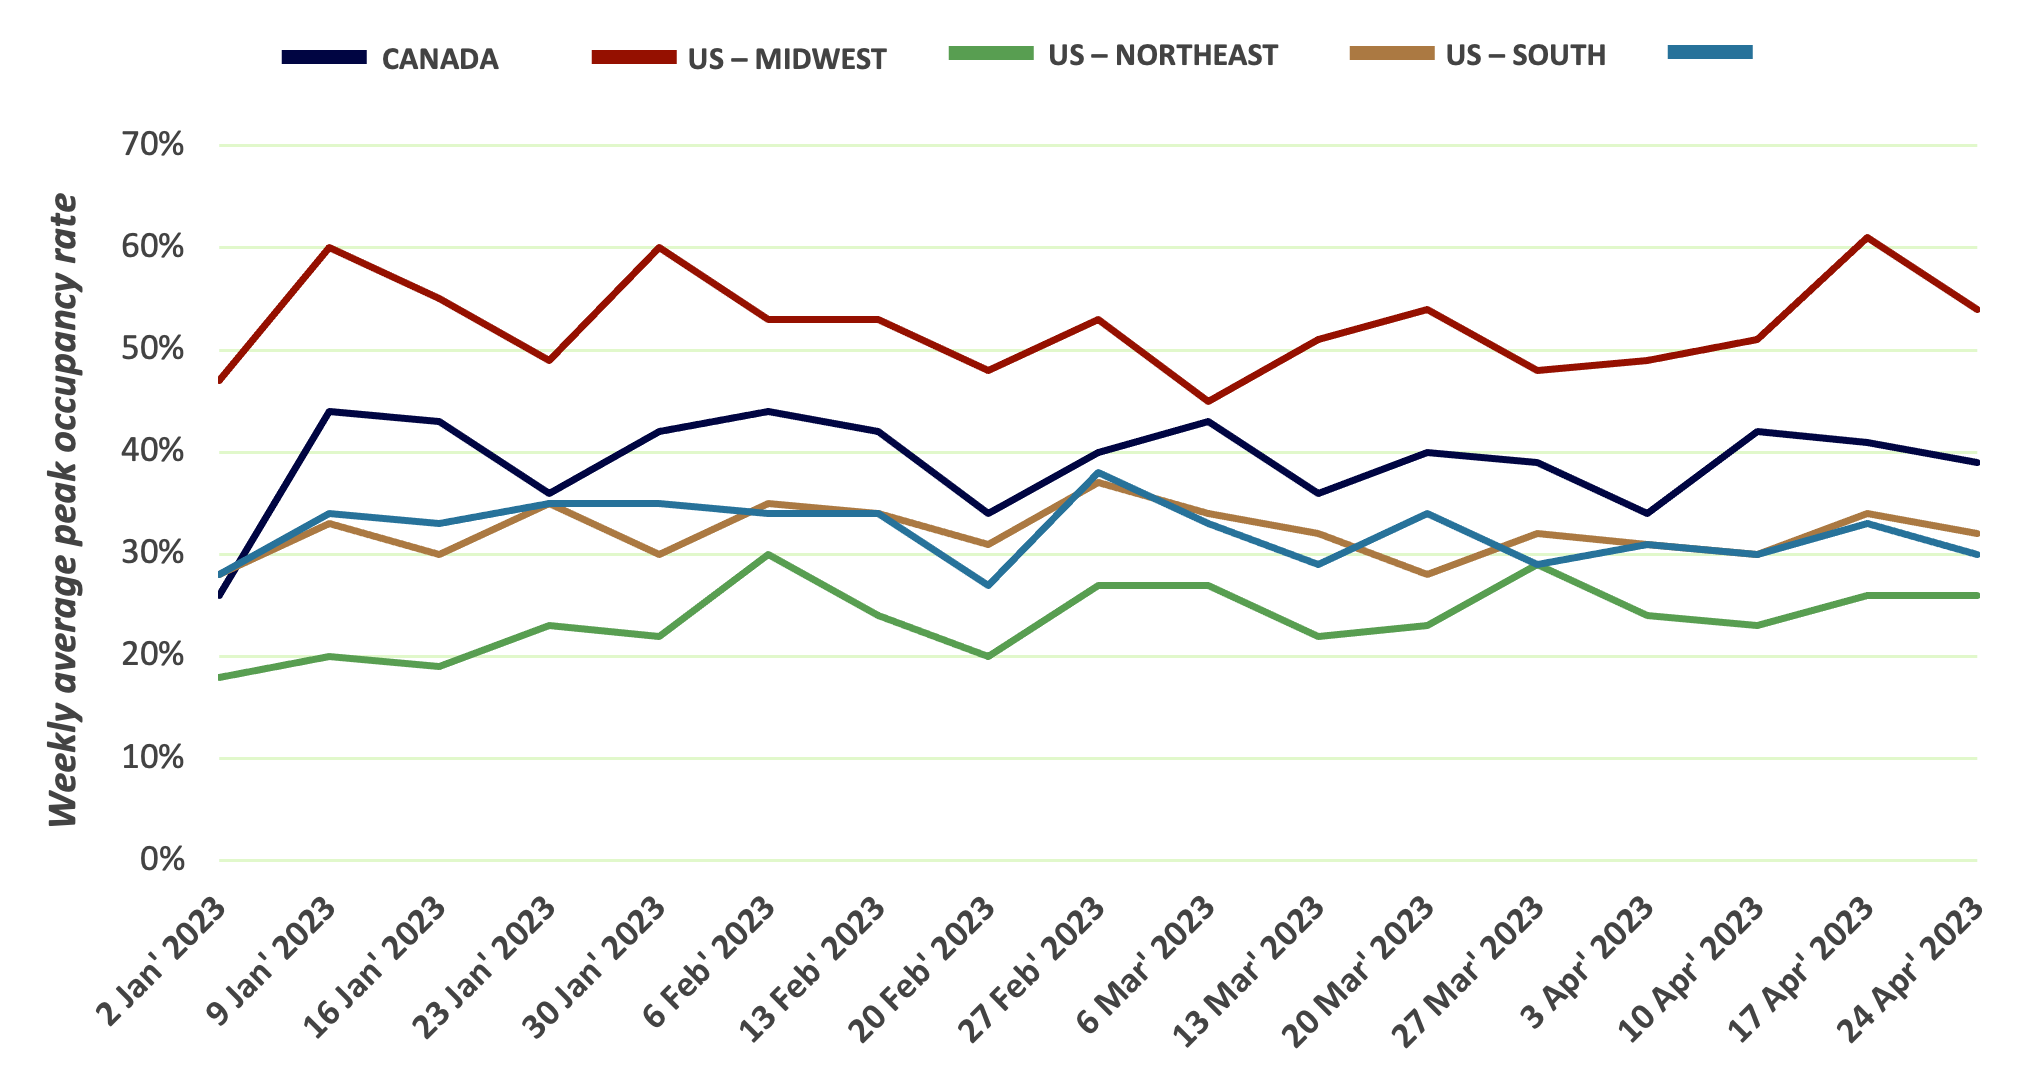
IN US, MIDWEST REGION MAINTAINED HIGHEST WEEKLY AVERAGE PEAK OCCUPANCY RATE
Significant differences in occupancy rates between regions have continued into 2023, with the US Midwest averaging 117% higher than the Northeastern region. Similar variances were observed across Europe and APAC.
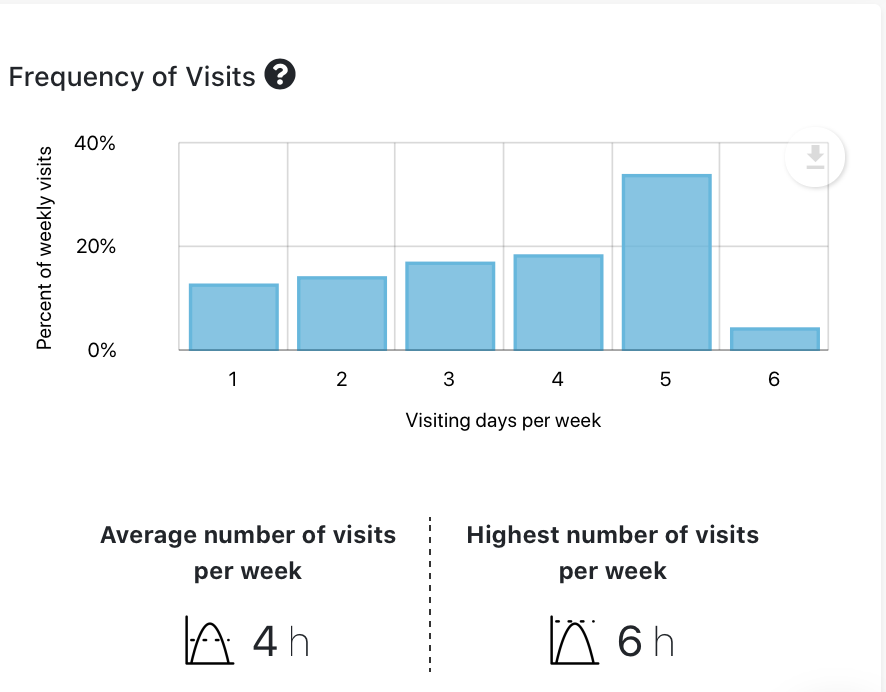
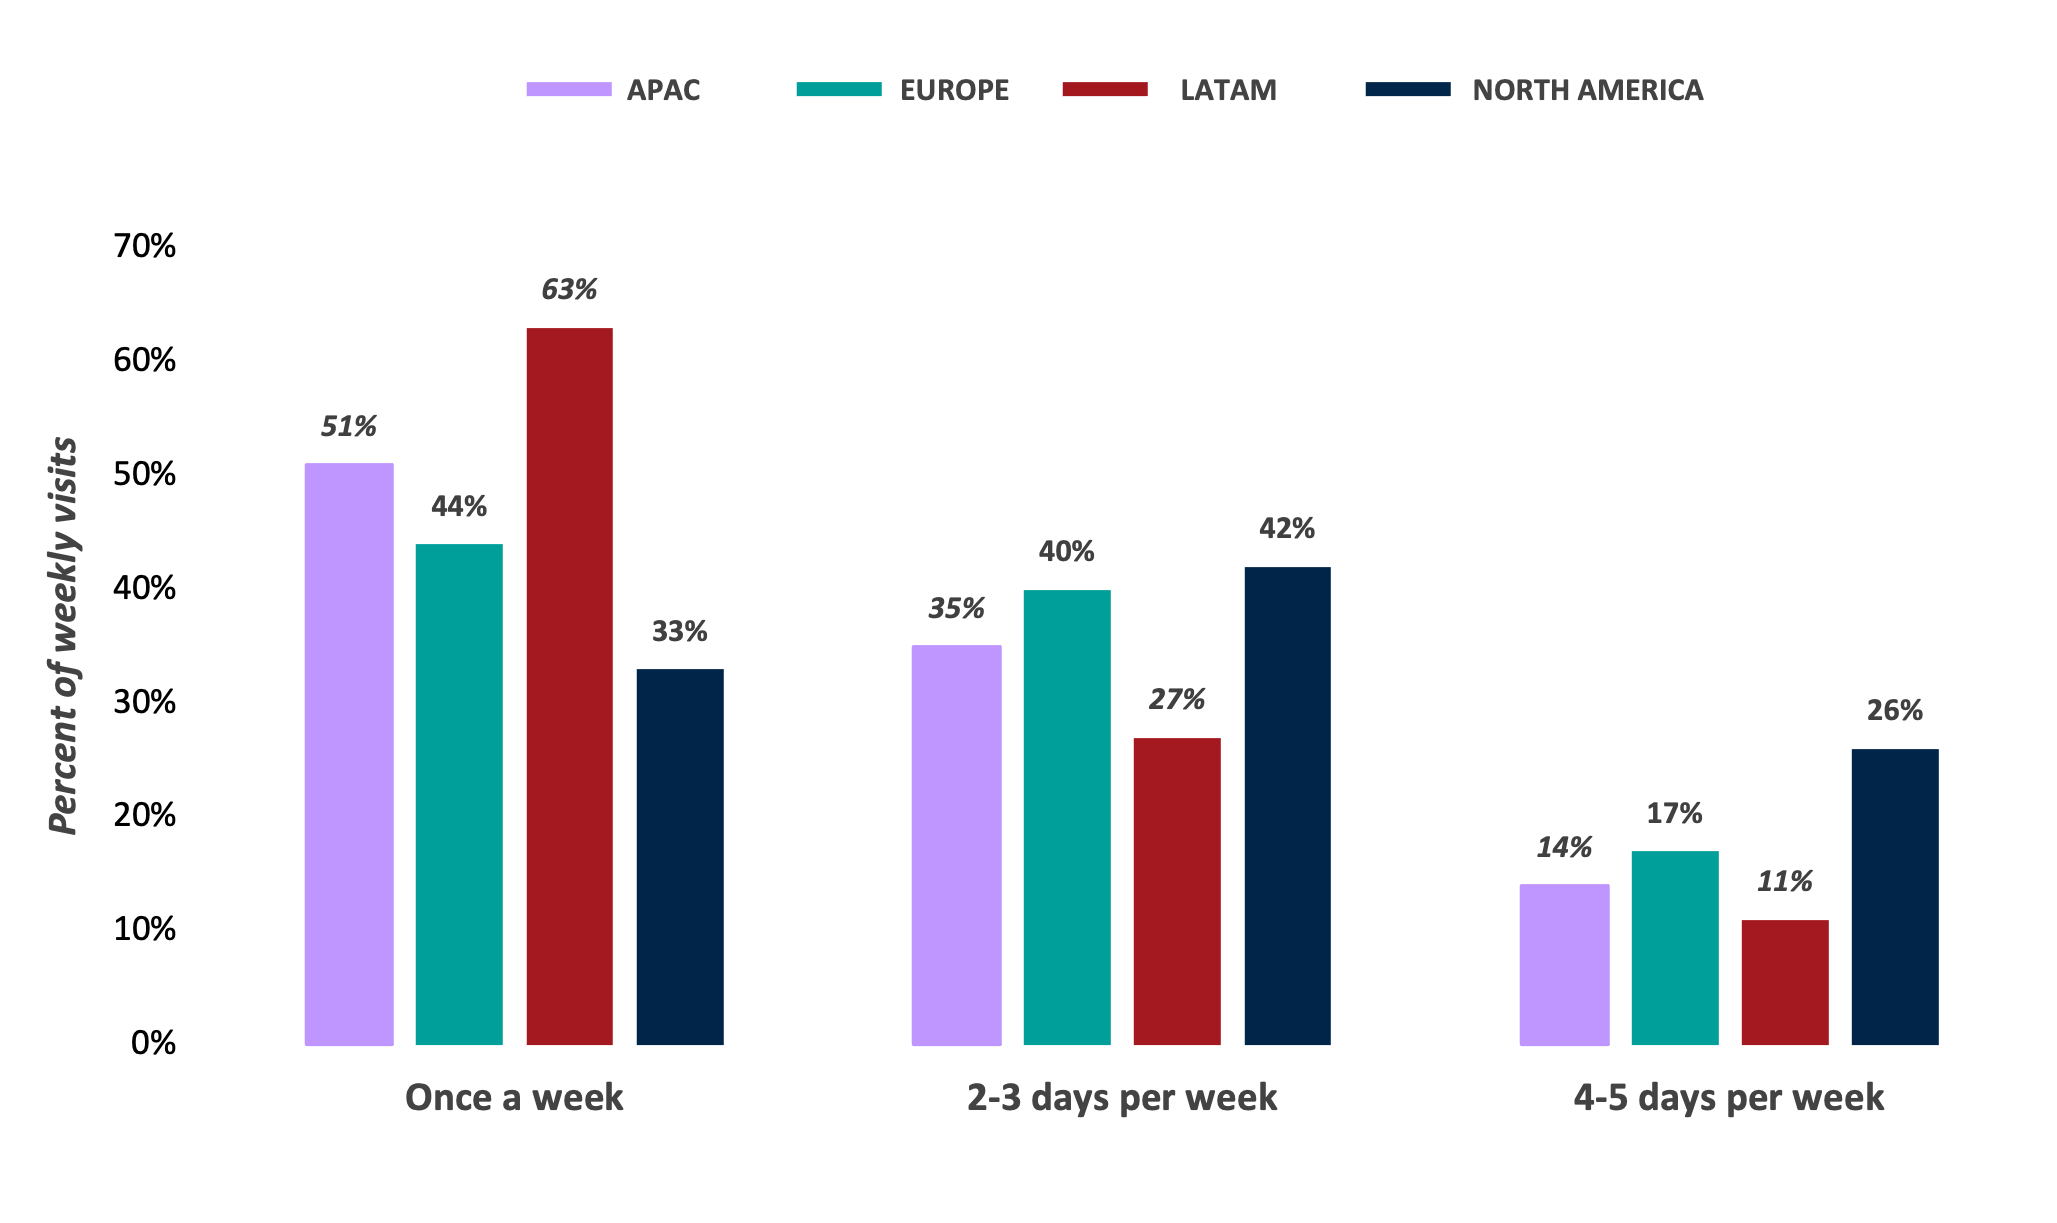
VISITING OFFICE ONCE A WEEK REMAINS MOST POPULAR FOR MAJORITY
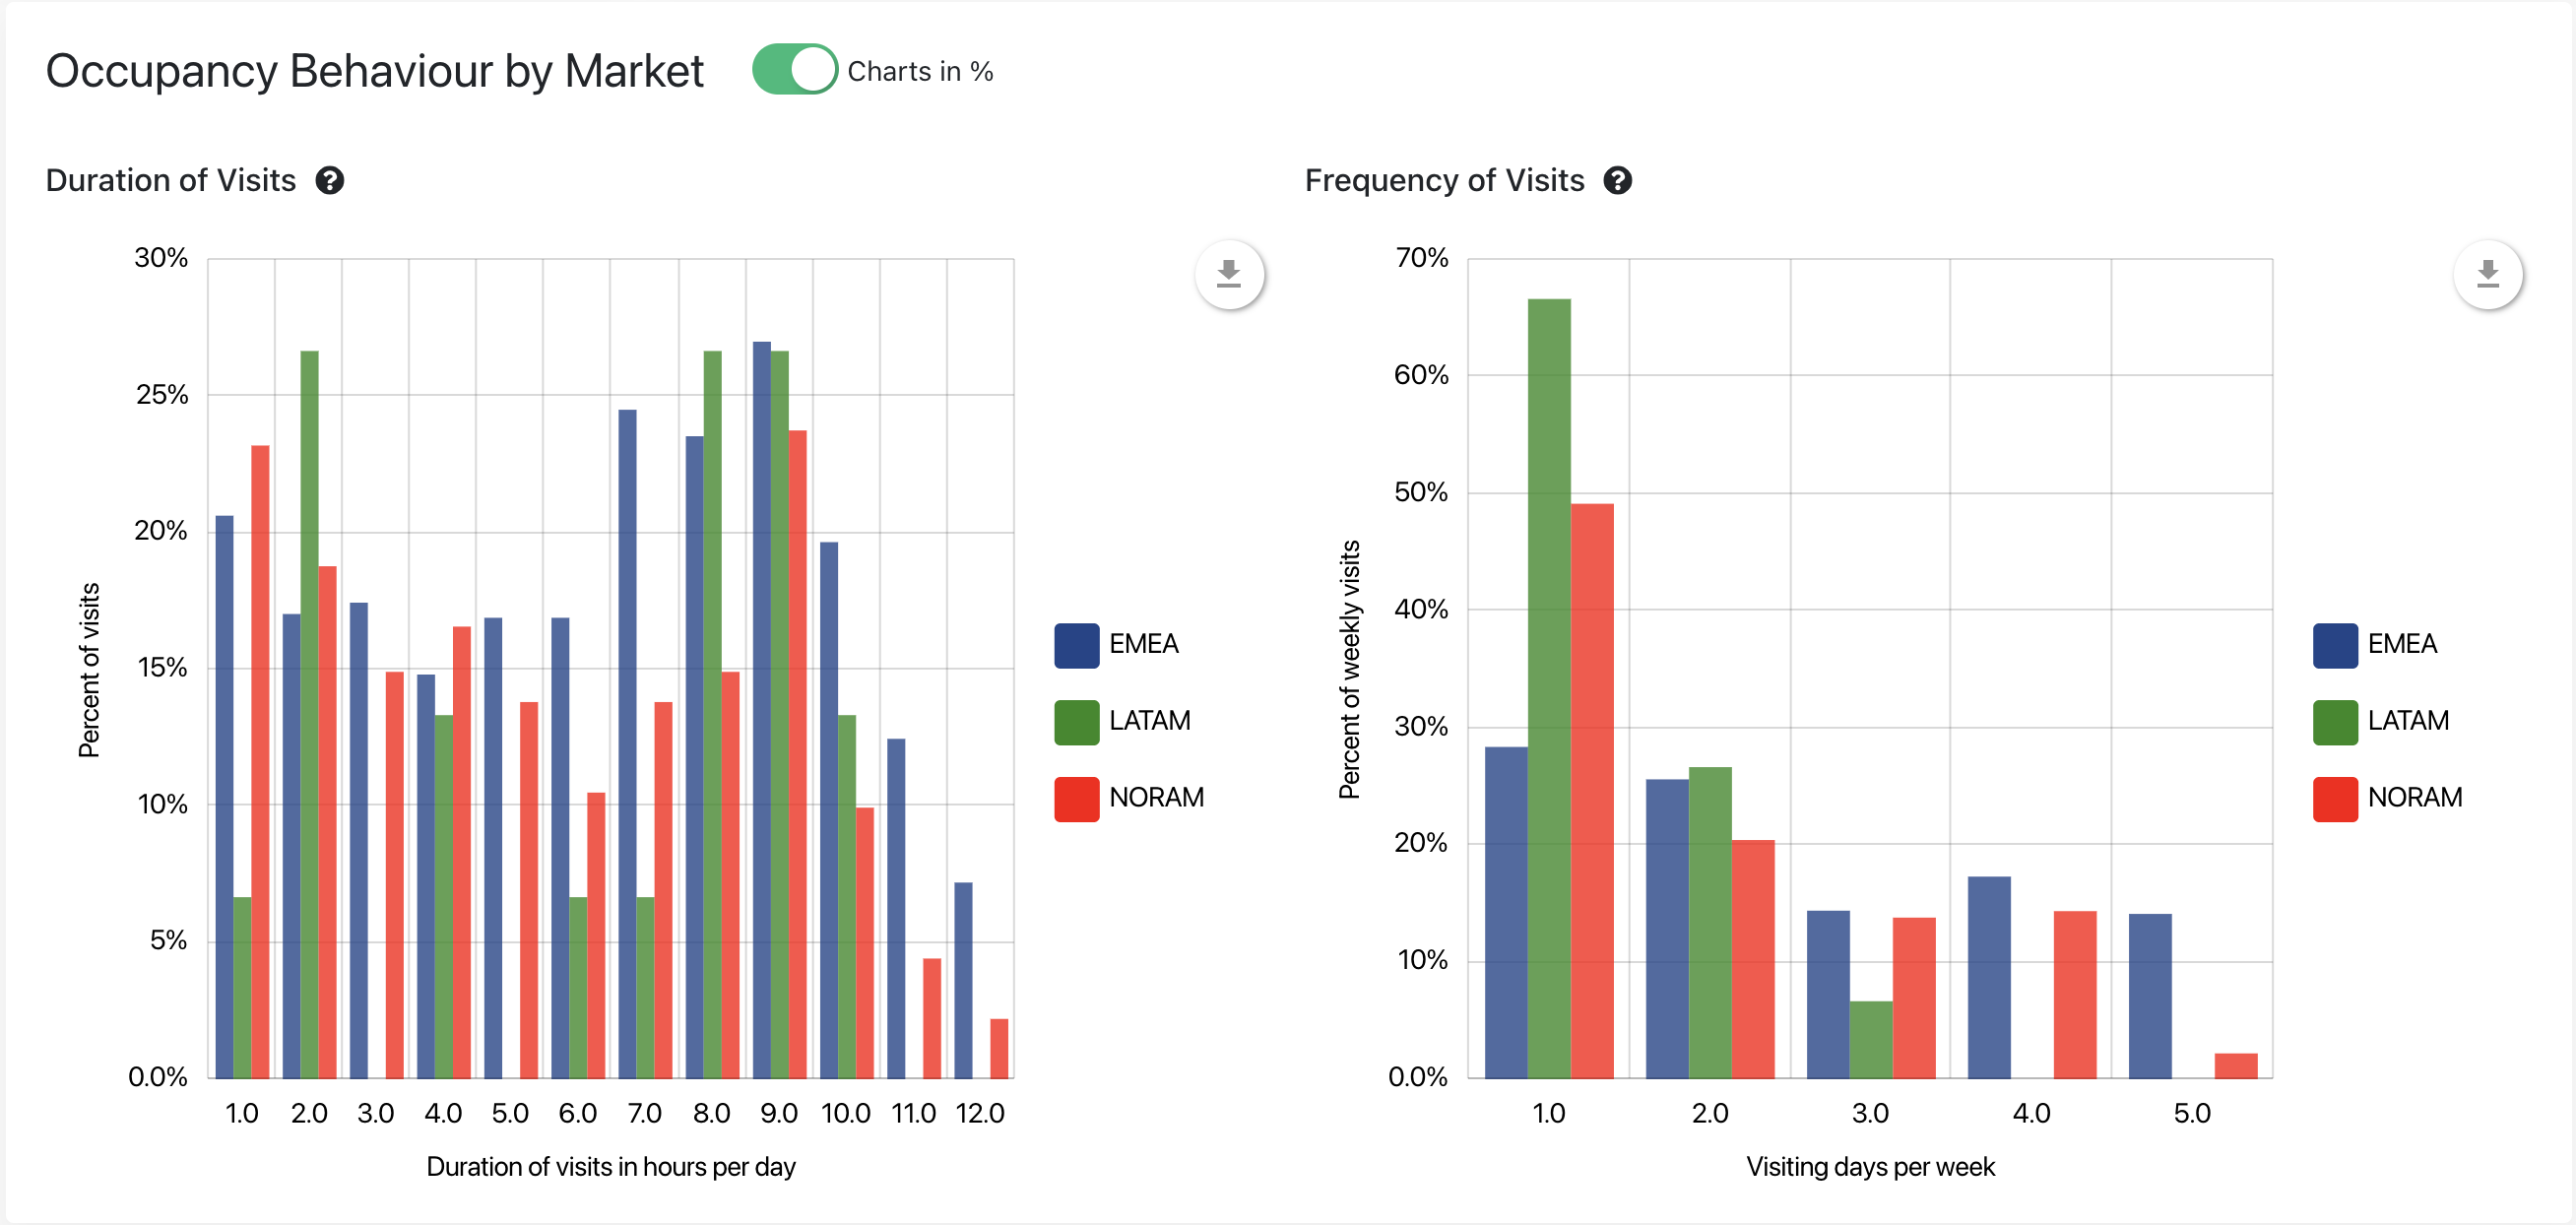
North America recorded the most frequent office visits, while once-a-week office visits heavily predominated in LATAM.
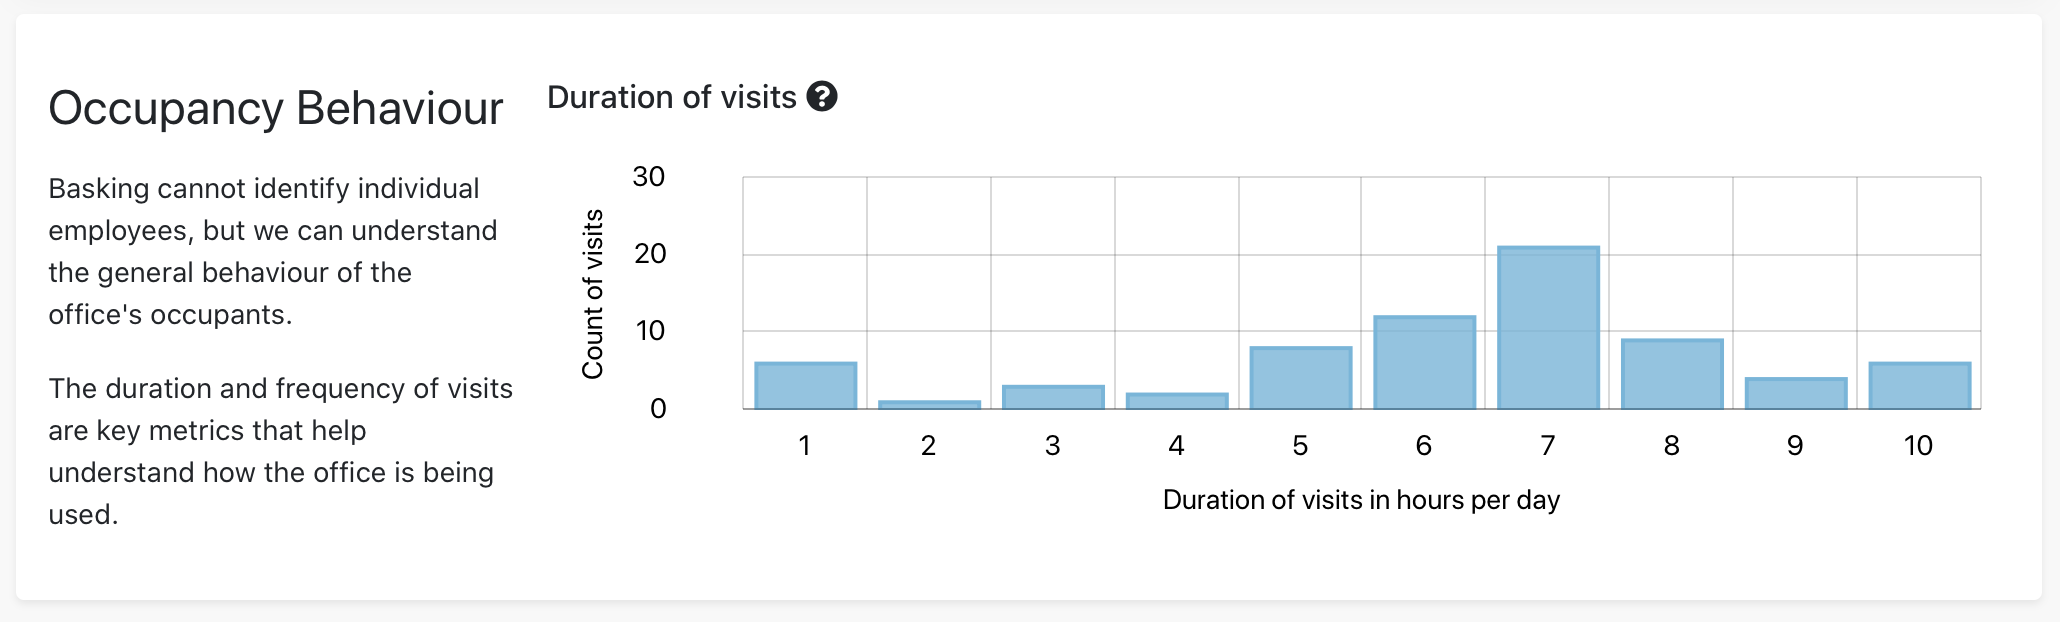
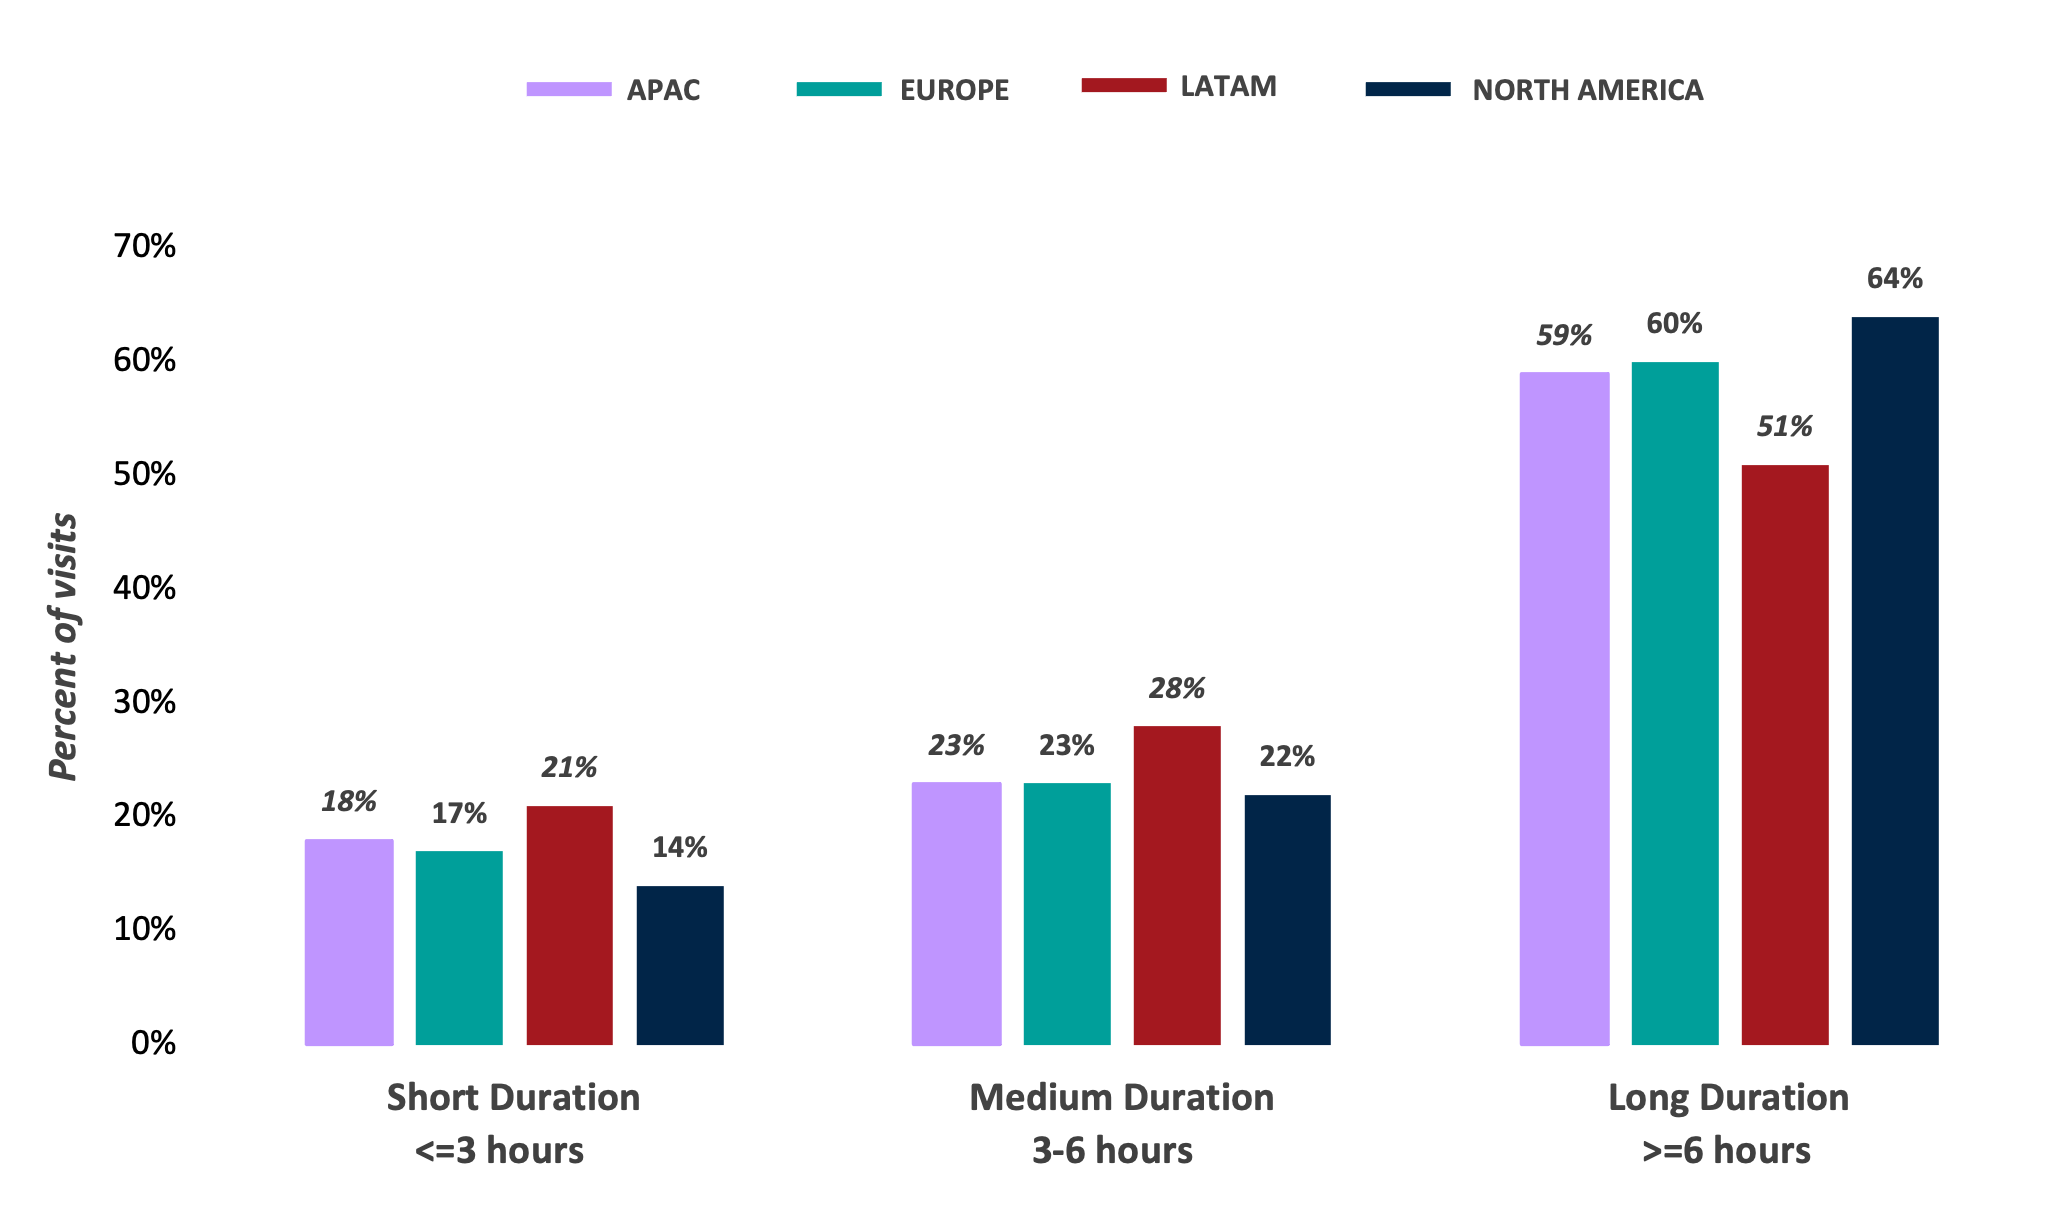
LONGER DURATION VISITS PREFERRED ACROSS ALL REGIONS
Over half of visits in all regions lasted 6+ hours, reflecting a shift to more concentrated office visits among workers worldwide.
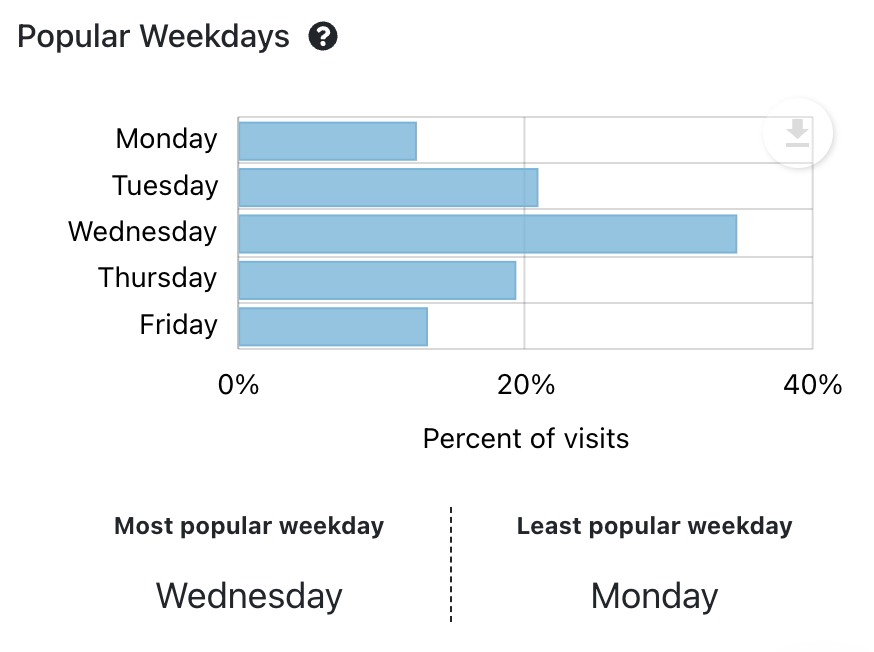
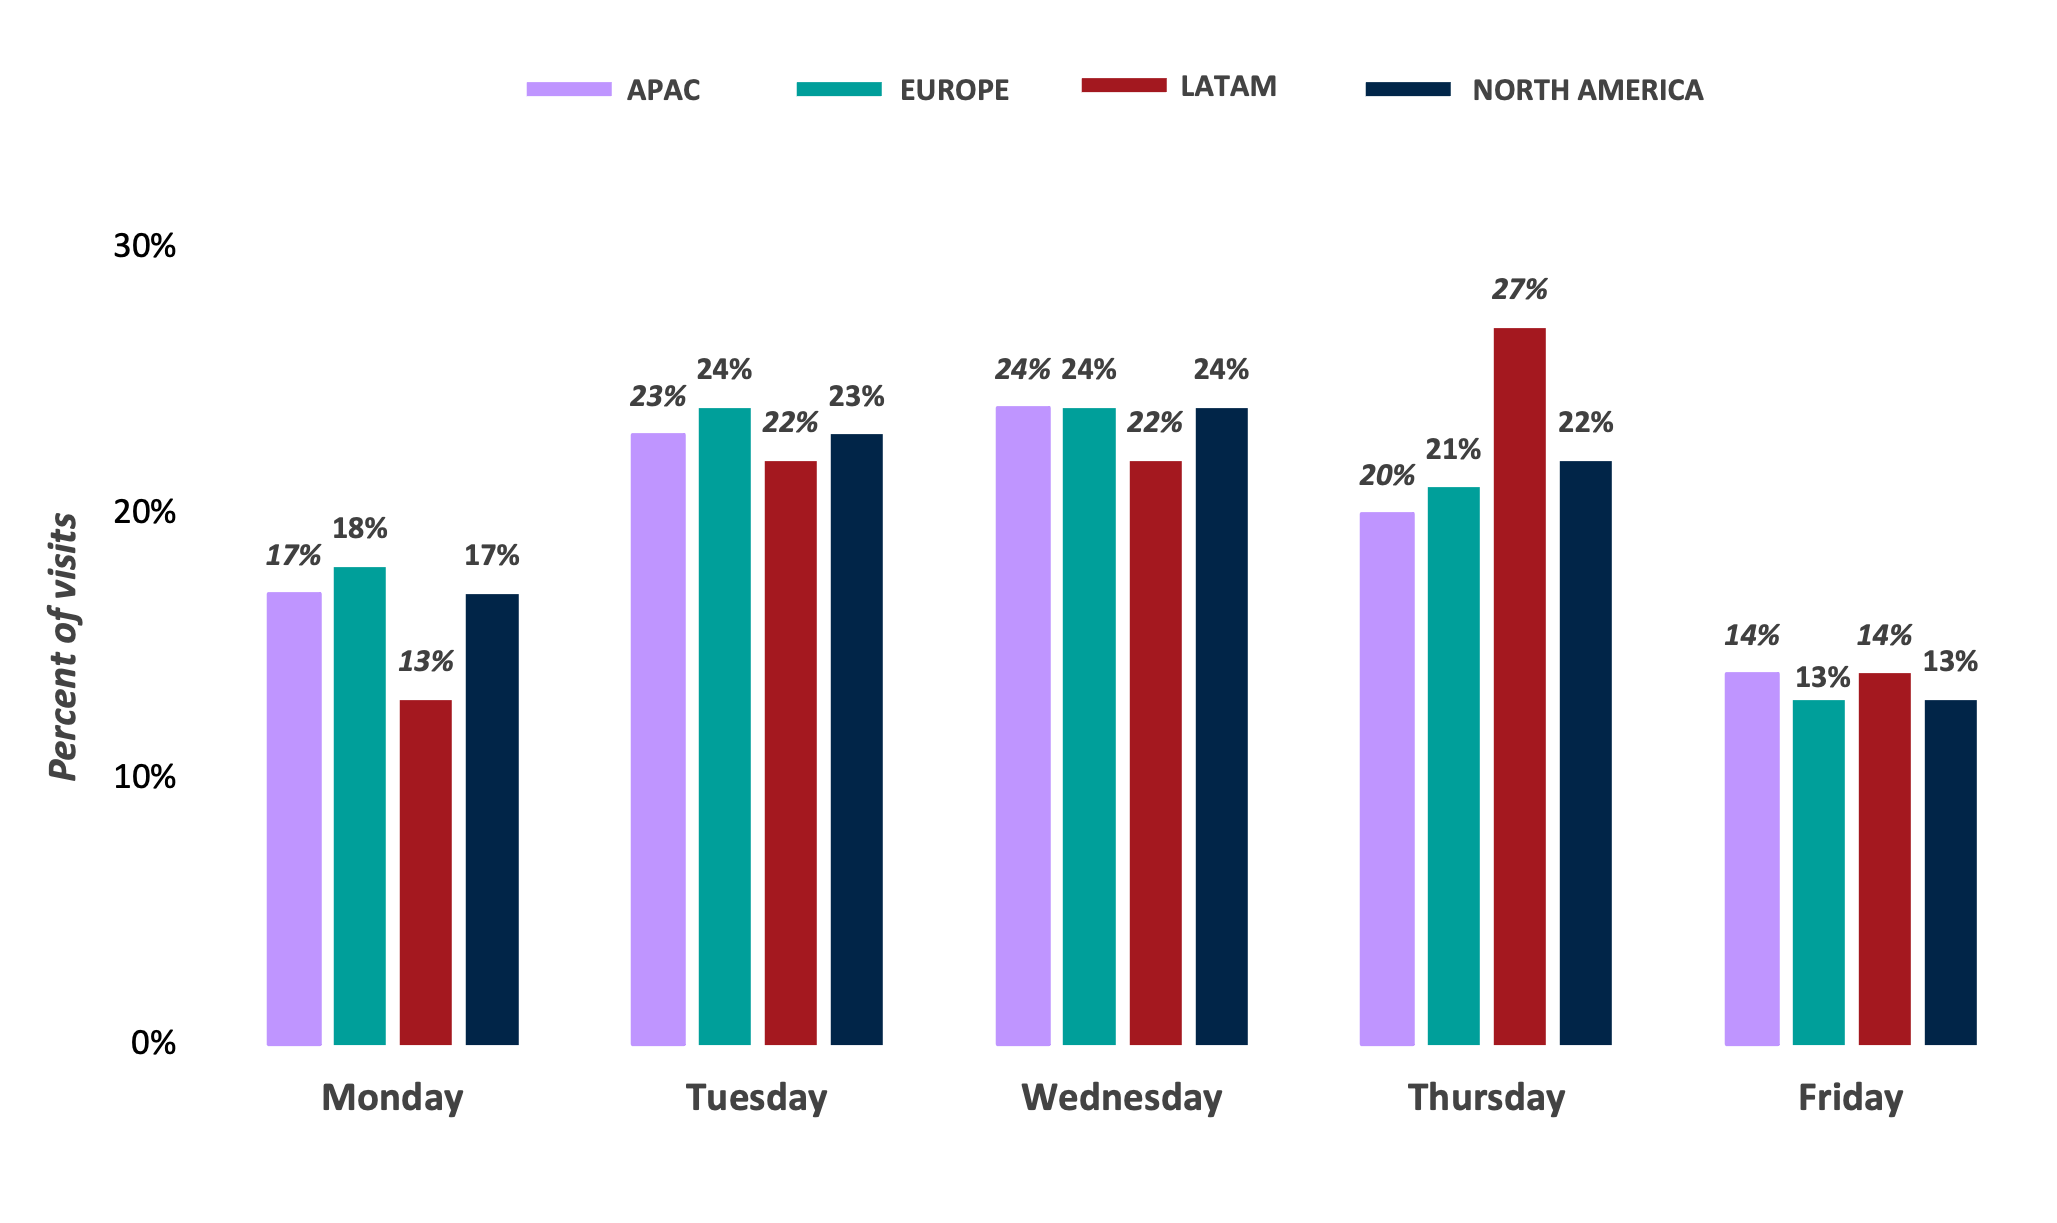
HYBRID WORKERS DISPROPORTIONATELY FAVOR MIDWEEK VISITS
Friday remained the least busy day across all regions, with only 13-14% of visits, and Monday followed as the second least popular day.
The continued adoption of hybrid work in 2023 highlights the evolution of office occupancy trends globally. Companies are responding to the changing needs and expectations of employees, resulting in a significant shift in the workplace environment. As hybrid work policies become more commonplace, it is essential for companies to closely monitor their office space usage to optimize their portfolios and support their overall business strategies.
Check out the full Basking report on Q1 global occupancy benchmarks, and don’t miss our webinar that dives deeper into the data and key insights for 2023. Contact us to learn more about how we can help you achieve success in 2023 and beyond.