Workplace Occupancy Platform for the Digital Leader
Our workplace occupancy platform has three main components. The web application itself, a robust API and automated reporting functionality.

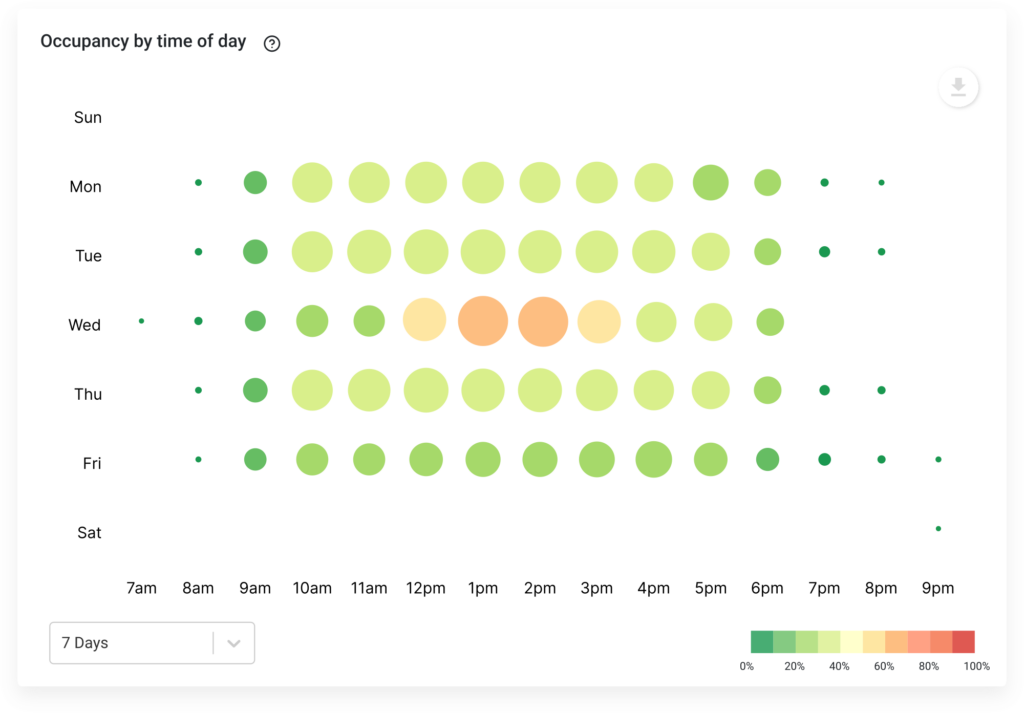
Dashboards via web application with portfolio, site levels and heatmap analytics
Powerful and fully automated reporting functionality tailored for CRE and workplace with PDF export

API and automation for advanced real estate and workplace teams

Keep an eye on your portfolio
With portfolio level occupancy analytics, CRE and workplace managers can understand high level occupancy trends and focus their attention where it matters.
Compare Regions
Compare high level occupancy trends aggregated by regions, and understand pockets of opportunity before diving into the details.
Occupancy overview at scale
Occupancy metrics aggregated and by regions
Portfolio overview
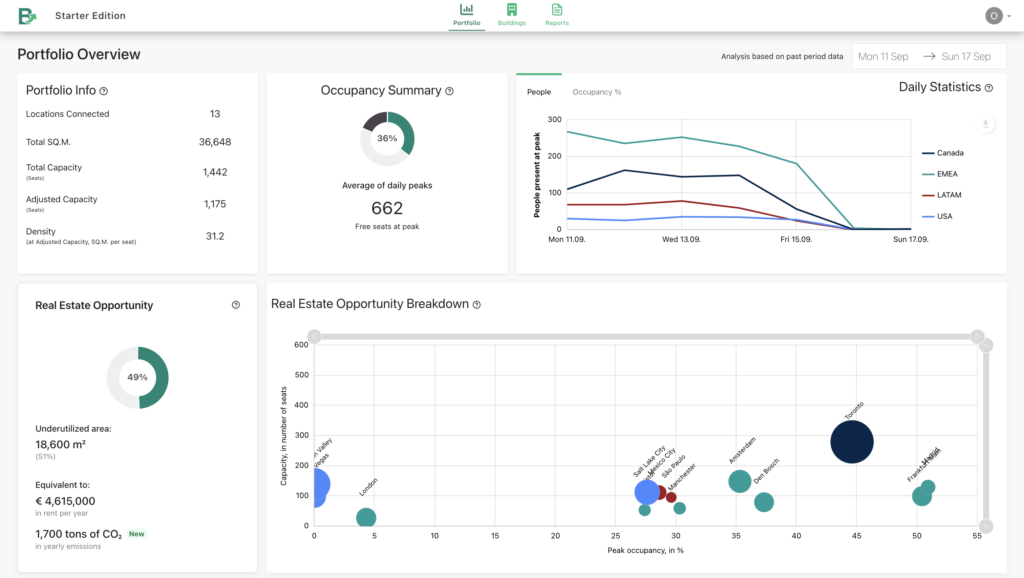
Understand Outliers
Break down your portfolio occupancy by regions, and understand high level outliers.
Identify most occupied sites in your portfolio or region, and understand where employees are facing overcrowded spaces
Know your opportunities by listing out the least utilized spaces. Start repurposing space or simply be ready when the lease expires
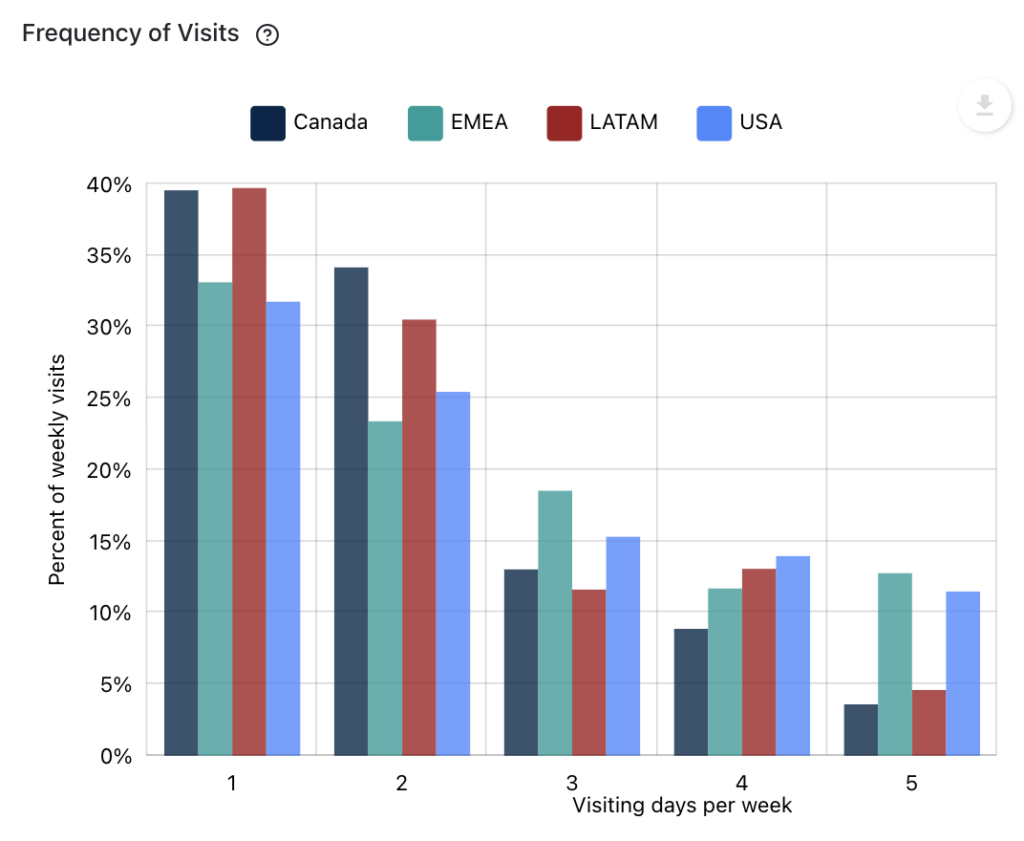
Understand and compare occupancy behaviour patterns and adherence to RTO goals
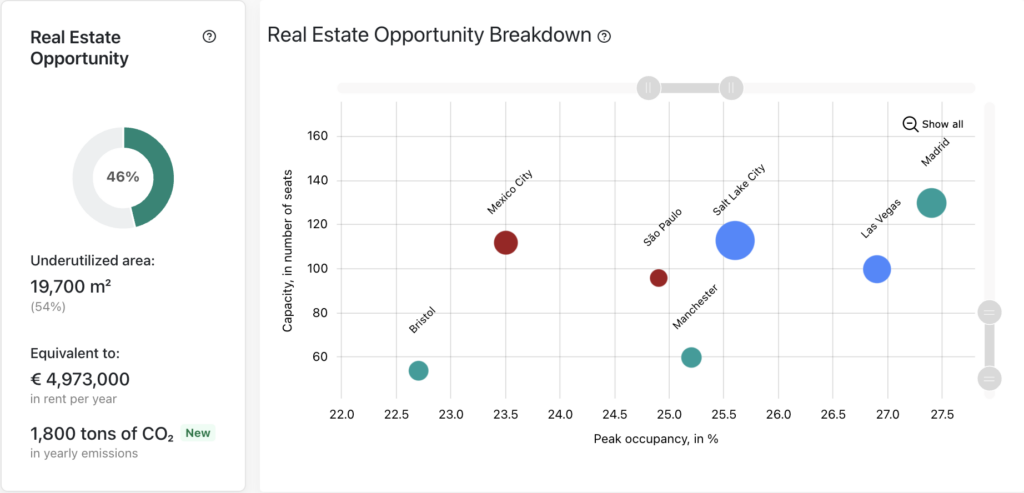
Ranking of Real Estate Opportunities
Understand at a glance your global real estate utilization and it’s environmental and economical impact.
Total amount of area underutilized across your portfolio
The economical value in terms of rent and the ecological impact in terms of yearly CO2 emissions helps you understand the magnitude and importance of your global underutilization
Identify which sites are contributing the most to the underutilization using the interactive bubble chart to breakdown by locations
Understand at a glance how a site performs
With site level occupancy analytics, CRE and workplace managers can understand the occupancy of a specific site, and find opportunities.
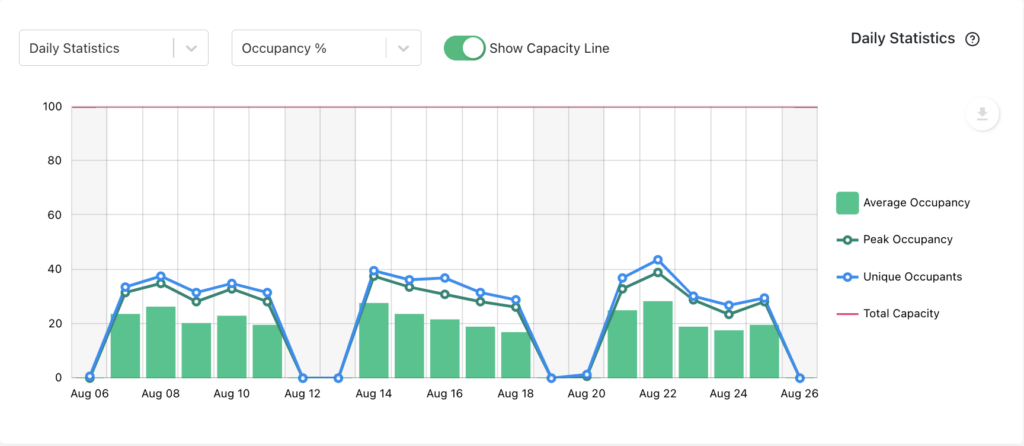
Occupancy Metrics and KPIs
Basking gathers occupancy data using multiple integrations. Our site level dashboard offers an efficient and elegant way to explore the occupancy data for a specific site.
Get started for free with Instant Insights
Visualization of CRE and workplace specific metrics and KPIs
Detailed documentation and on-site help articles
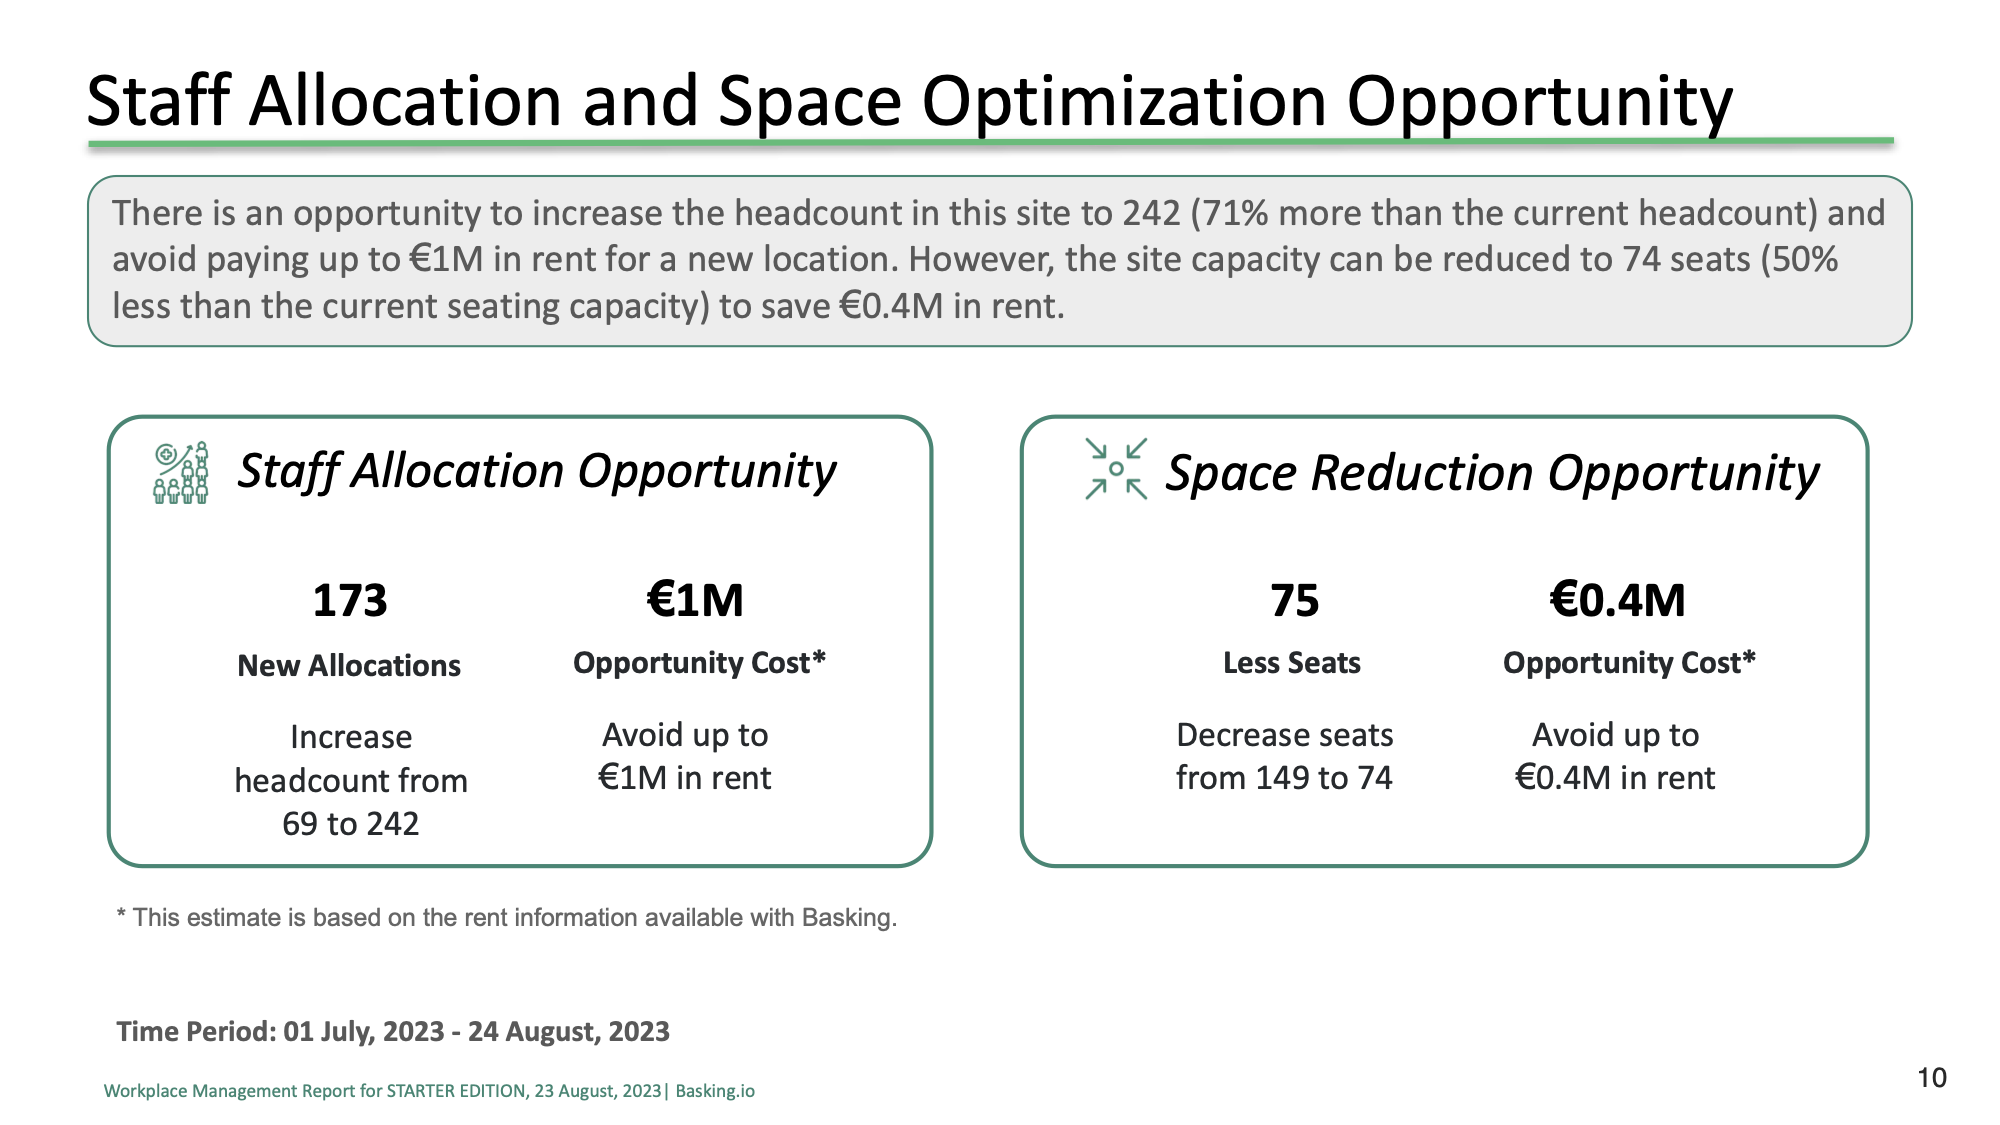
Opportunity Insights
Underutilization of your office space represent opportunities. Possible actions depend on your specific strategy. Basking focuses on surfacing those opportunities and offering a variety of options for possible actions, calculating the estimated impact on each of them to aid the decision process.
Headcount Opportunity
Space Opportunity
Return-to-Office Opportunity

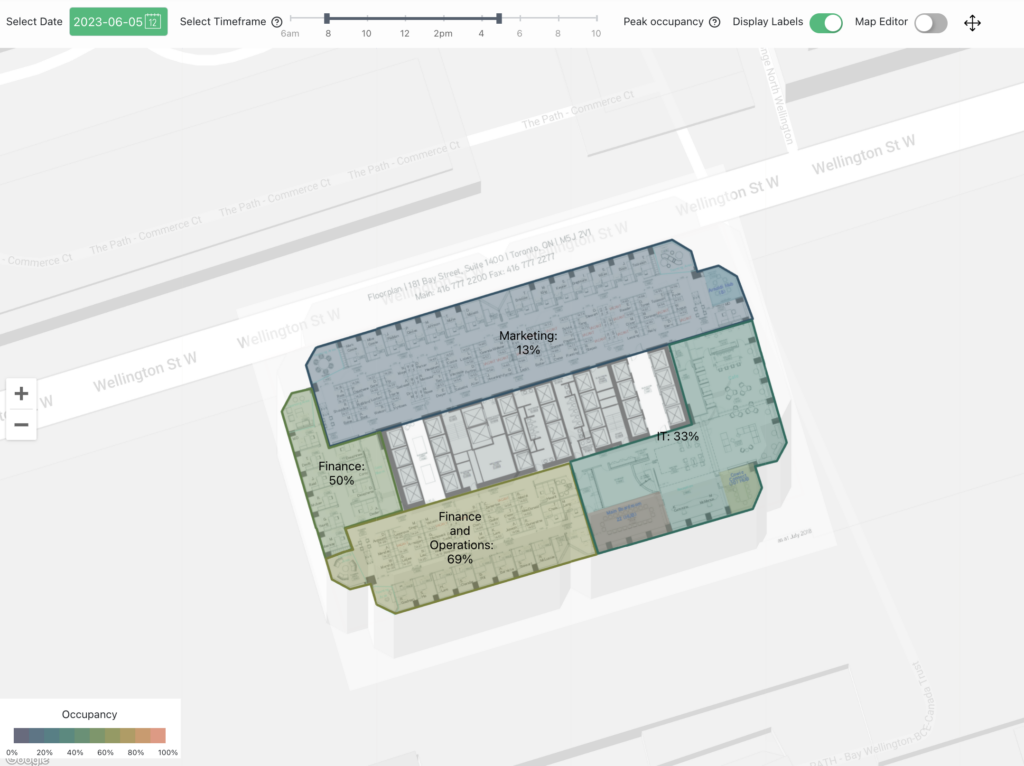
Breakdown by Floors and Neighbourhoods
CRE specific metrics and KPIs can be further broken down by floor and neighbourhoods, allowing for detailed analysis of occupancy patterns.
Occupancy and behavioural metrics by floor and areas
Compare floors and areas
Ranking of peak occupancy by floors
Share Powerful Reports with Occupancy, Insights and Recommendations
Powerful reporting functionality enables CRE and workplace managers to understand occupancy in a native interface, and share the results with the rest of the team to purposefully drive organizational change.
CRE Goal Specific
It’s like ChatGPT for occupancy analytics. Our reports are CRE goal specific, and thus each report guides the reader through a different storyline. Reports contain not only goal specific insights and recommendations, but also explain occupancy data within the context of the report’s goal.
Portfolio Management Report
Return-to-Office Report
Workplace Management Report
Business Unit Space Management Report
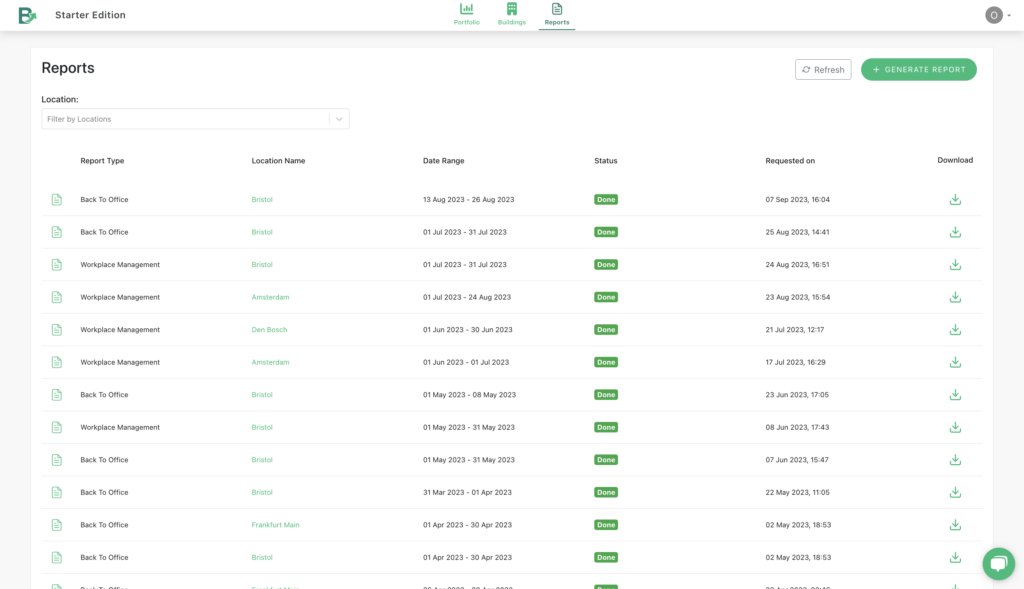
Fully Automated PDFs — Available on Demand
Need a report? Urgently? No worries, with Basking’s on demand reporting functionality, you can schedule your own reports and download within minutes.
Generate reports within the app
Download reports in PDF format for easy access and sharing
Custom Development for Specific Reports
Need a report we currently don’t offer? No problem, Basking acts as your extended real estate analytics team, understanding your needs and solving them is part of our job.
Customer Success process brings our team up to speed on your specific reporting needs
Our analytics team works hand in hand with you to prototype the new report
The new report is made available through our application
CRE Specific Analytics
The only Workplace Occupancy Platform that speaks CRE, seamlessly guiding workplace and real estate managers from data collection & visualization, analysis & KPIs to knowledge & actionable insights.

Understand occupancy at scale
Basic occupancy metrics are essential to understanding how your employees are using the available space.
At Basking, basic occupancy metrics are the base fur more advanced KPIs, insights and recommendations.
Learn More
People count and space opportunity
In case some of your locations are showing underutlization, Basking will recommend two different opportunities to tackle the issue, either increasing the headcount or reducing the workstations.
Each insight shows the estimated occupancy if acted upon, along side with the commercial value and environmental impact.

Occupancy benchmarks built in
Compare occupancy, duration and frequency of visits across your portfolio against our benchmarks.
Understand what differences in your portfolio can be attributed to the impact of different locations, and identify anomalies.

Return to office
Return to office opportunities and scenarios are essential to estimate the impact of RTO goals on your office occupancy.
Basking let’s you define your RTO goal, understand compliance over time, and explore occupancy scenarios for alternative, more ambitious goals.

Repurpose space
Understand required shifts in space types, e.g. from workstations to break out areas or vice versa.
Basking has built-in insights and reports highlighting the current and optimal ratio of space types.
Head count growth projections
Compare occupancy, duration and frequency of visits across your portfolio against our benchmarks.
Understanding these questions is essential to plan ahead with your CRE planing, especially for fast growing organizations, or fast growing locations.

Meeting room utilization
Meeting room utilization, correct meeting room ratios, and sizes of meeting rooms are essential for a productive and empowering working environment. At the same time, it is complex to analyse and get right.
Basking has specific functionality around meeting rooms that let you track booking, usage, and occupancy in order to present recommendations about amount and size for meeting rooms.
OPEX optimization
In case your altering your office space/ lease is not an option, Basking can provide recommendations for temporarily closing spaces, food waste avoidance, optimization of employee transportation schedules.

Dynamic FM
Why clean if nobody was there? Automatically control your FM processes using occupancy as a trigger.
Basking lets you automatically send notifications to cleaning providers, ordering food, ordering supplies and other FM related activities.
Do you have other plans for Occupancy Analytics?
Great, we have the analysts. Let’s discuss your specific questions so that we can propose new metrics, insights and recommendations for your specific usecase.
Your Data — Delivered Your Way
Basking has a commitment to transparency and portability of data. With our comprehensive API, developers and advanced users can reach to the occupancy data, KPIs and insights directly.
Data Lake Integrations
Customers with an advanced digital strategy might want to read Basking data into their Data Lake. Basking supports this functionality out of the box via our API and our comprehensive Python SDK.
Third Party Applications
Allowing Basking’s data to be visualized and used in other corporate applications allows for more transparency and usage of the data. Basking supports third party developers to integrate with Basking’s data.
Join Fortune 500 Organizations
Start for free with Instant Insights
Personalized onboarding
Access to all features
Get started
If you want to know more about how our product works or have additional questions, please reach out to us: