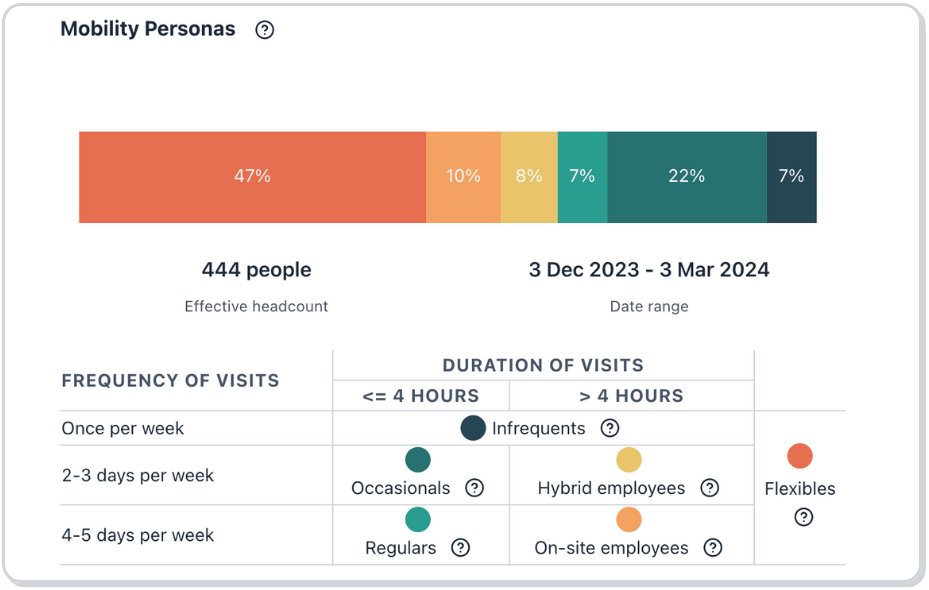
Frequency and Duration of visits at portfolio level


Analyzing the Frequency of Visits and Duration of Visits at office-level helps real estate and workplace managers understand how individual offices are being used.
We are now launching the new Frequency of Visits and Duration of Visits dashboards at portfolio level, aggregated by regions. These two metrics give insights on how your employees use offices across regions.
The new feature supports the following use cases:
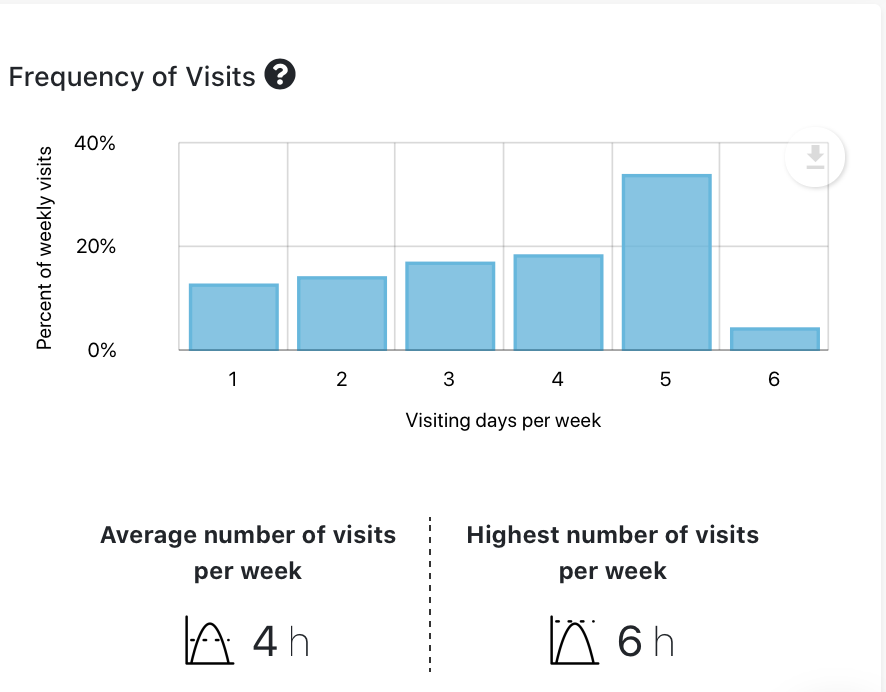
Use Frequency of Visits to adjust your workplace mobility policies.
Analysis of frequency of visits by markets across your portfolio can provide the data needed to develop the flexible workplace policies as well as to understand how well the policies are adopted by employees.
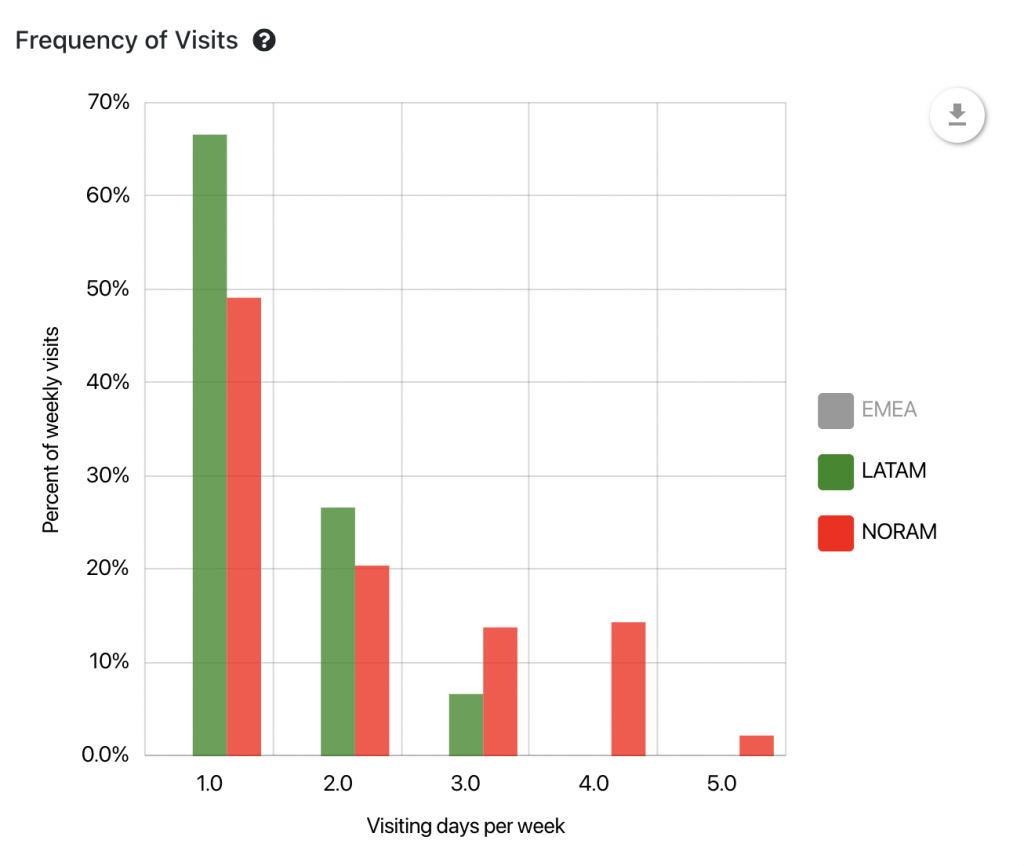
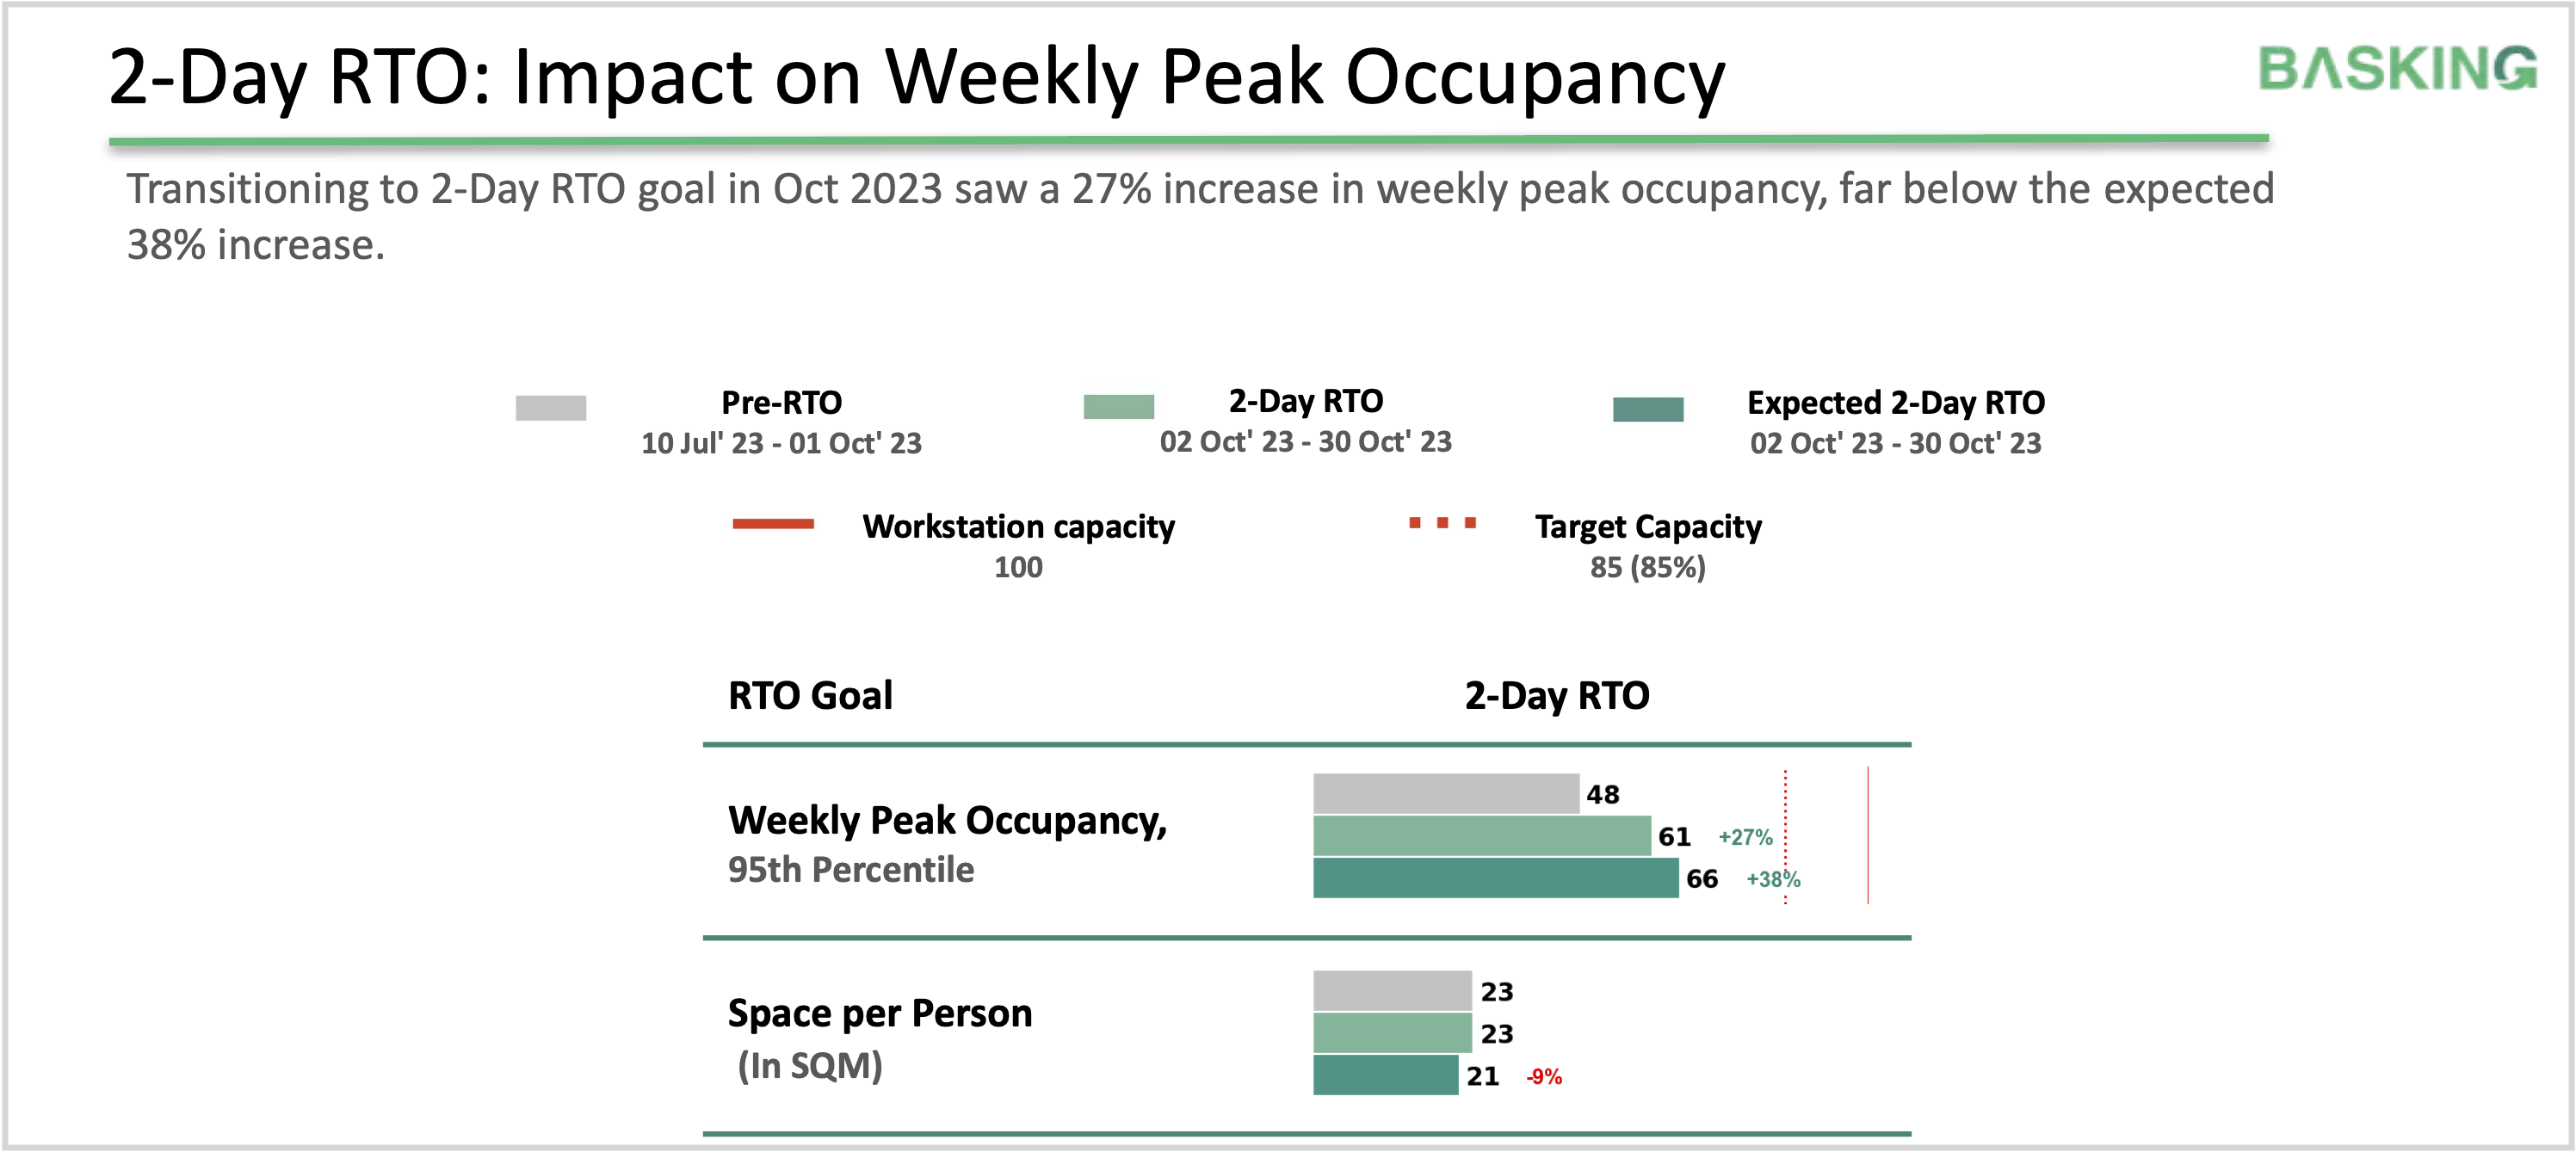
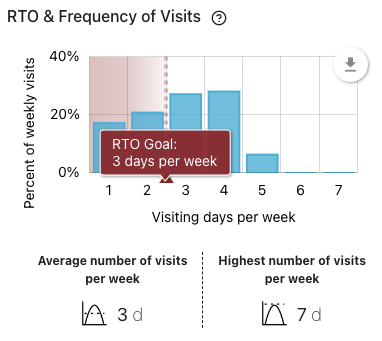
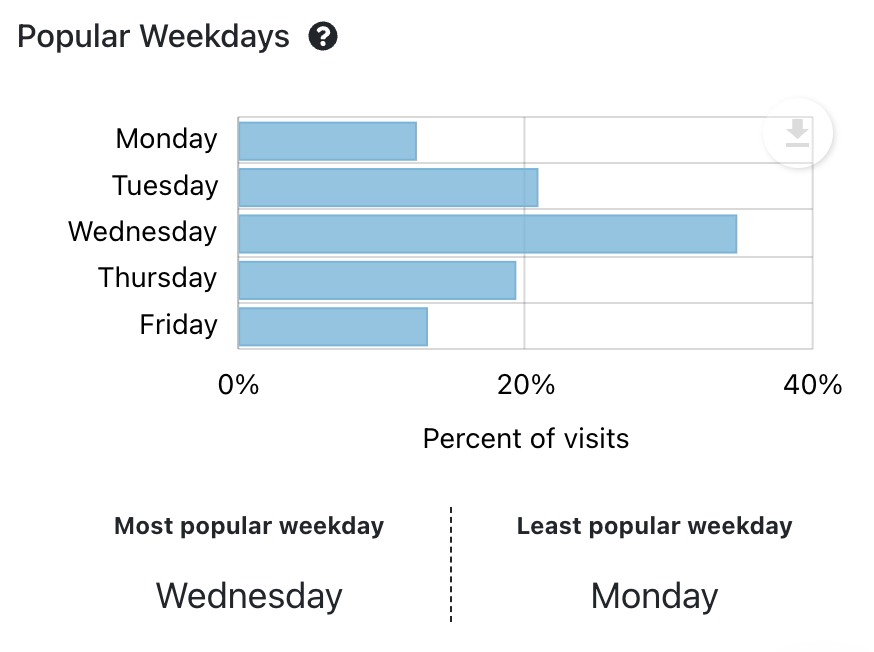
Figure 1 represents the frequency of visits across different markets for a sample organisation. It shows the difference between the employee behaviour across Lain America vs North America within the same organisation. The majority of employees in LATAM (67%) visit the office once a week and no one visited the office for more than 3 days in a week. On the other hand, in North America, 16% of the employees visited the office for more than 3 days a week.
Based on this information, decision makers can understand discrepancies in the workplace policies across regions and take steps to adapt to local requirements..
Use Duration of Visits analysis to optimize Fix-to-Flex Desk Policy
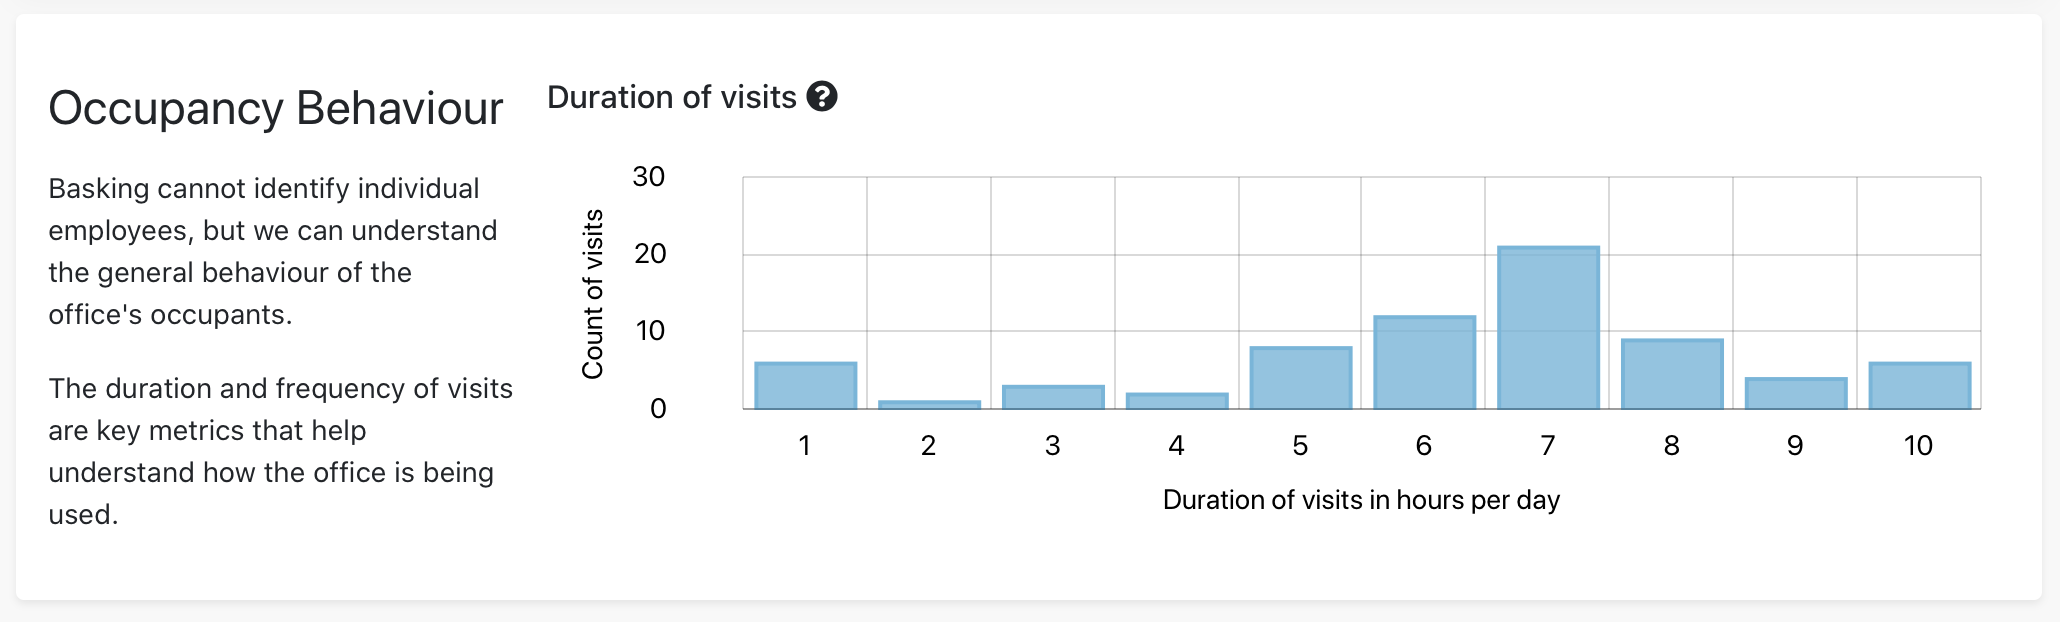
Similar to the frequency of visits, the duration of visits gives an important insight on how people are using your offices in different regions.
Generally, the shorter the visits, the more attractive is an intra-day fix-to-flex desk policy. Offices with a high tendency of short visits are good candidates for implementing a desk share policy, even sharing the same desk with multiple employees during a working day.
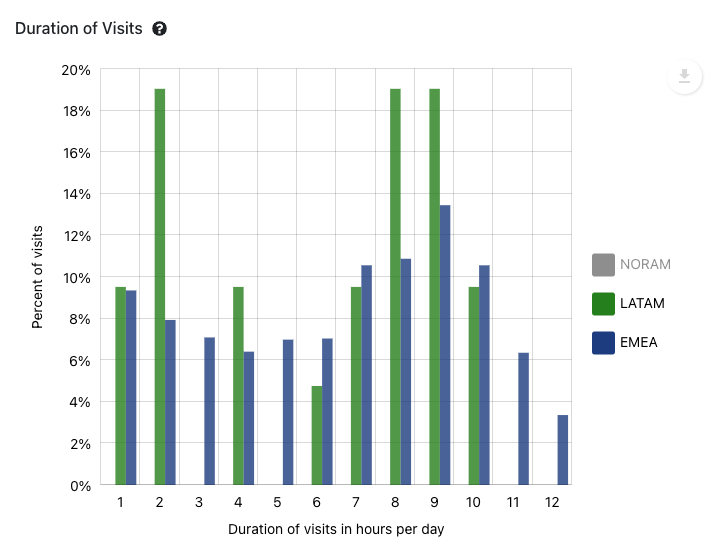
Figure 2 represents the duration of visits across different regions for a sample organisation. In this example, LATAM and EMEA look similar, but with a few distinct behaviour patterns. In LATAM, people don’t visit the office longer than 10 hours per day, whereas in EMEA the limit is 12. LATAM also has a peak of 18% of office population coming in for 2 hours per day.
Measure the Frequency and Duration of Visits in your organisation
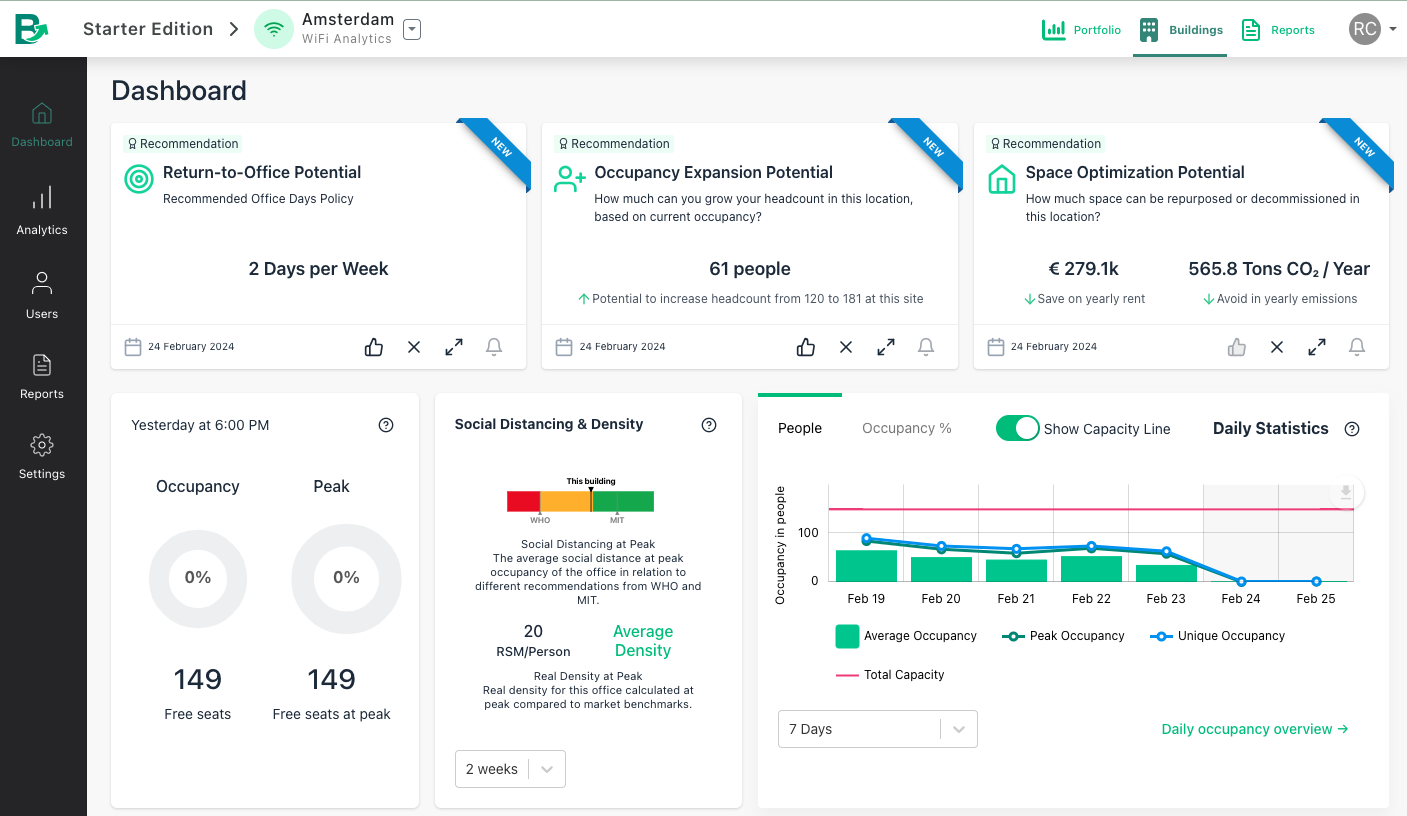
Basking provides a portfolio-level occupancy analytics platform which is easy to scale and meets all IT-security and data privacy requirements, such as GDPR. Measuring advanced occupancy metrics like the frequency and duration of visits across a portfolio is easily accessible and can help decision makers to align workplace policies and the real usage of office space.
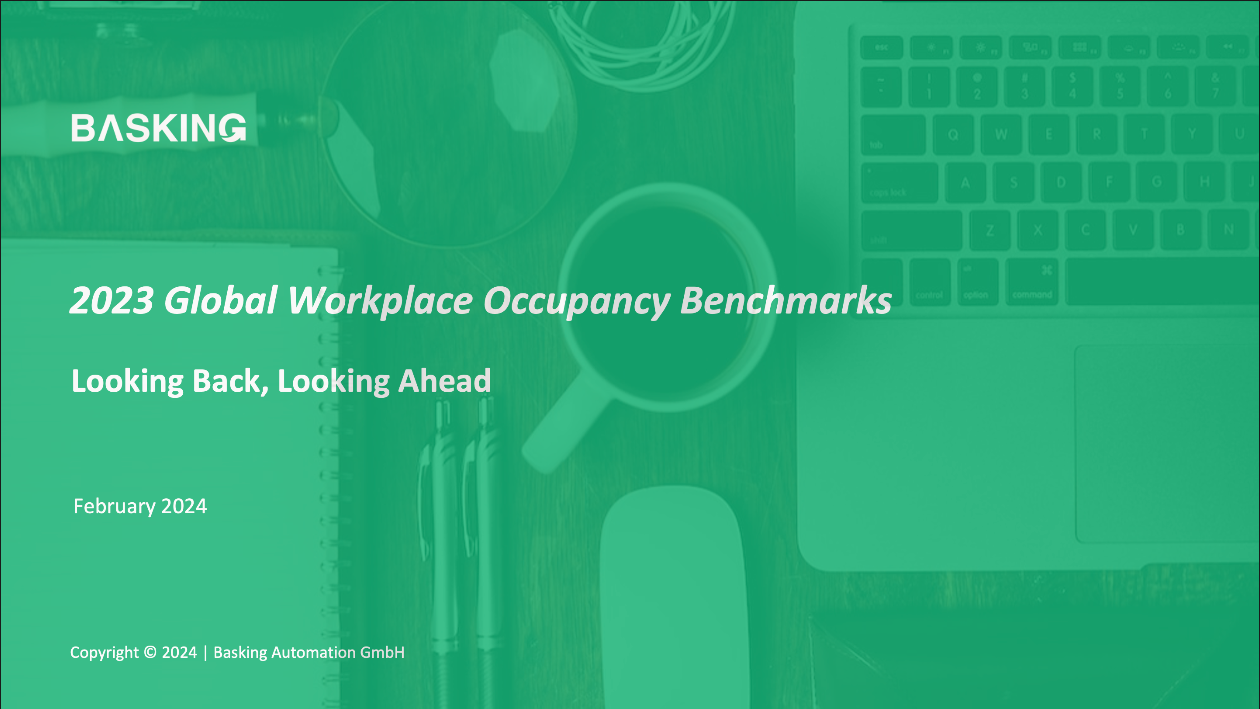
Global Occupancy Benchmarking Study
Recently, Basking released a global occupancy benchmarking study for office utilisation. The report aggregates metrics across different regions for various organisations and uses the frequency and duration of visit metrics to highlight behavioural differences.
Contact Basking
Basking is a customer-driven company. Our product evolves based on user’s feedback. Please contact us if you wish to know more or have ideas on how to improve on this part of the product.