New Insights Provide Stability for a Changing Workplace

The pandemic-fueled shift to hybrid work seemingly transformed the scope of the office and workplace management. As organizations look to right-size their strategy amid Return to Office (RTO) mandates and economic contractions, historical means of calculating occupancy are insufficient for understanding the evolving workplace ecosystem.
Utilization has become the dominant metric, focusing on usage rather than vacancy to support everything from occupancy planning and forecasting to capital expenses and improvements and ESG efforts. The increase in activity-based working, however, exposes a limitation—accounting for the variation and distribution across weekdays. To address this, Basking has developed the Occupancy Variance Index (OVI) to reflect the fluctuations in office visits across the week and equip you with the tools to make informed decisions about your site(s).
Historical Shift or Rapid Acceleration
Post-COVID, we witness an industry forever altered by widespread remote work. This transformation goes beyond behavioral changes; it reflects a new perception of the office, redefining its purpose and usage. Amid RTO policies and mandates, companies must now “earn the commute”—workers want to be in the office for a specific reason and the flexibility to keep working outside the office.
Interestingly, many of the neighborhood- and activity-based solutions being implemented predate the pandemic. Technology has created capacity, increasing our productivity, efficiency, and connectivity. The sudden need to work from anywhere has now built out a technical infrastructure that supports flexibility, further transforming the work-office relationship.
This is not the first significant shift in work dynamics but a testament to its ever-evolving nature. Key to navigating these changes is the ability to adapt, backed by data and insights.
Creating Actionable Metrics
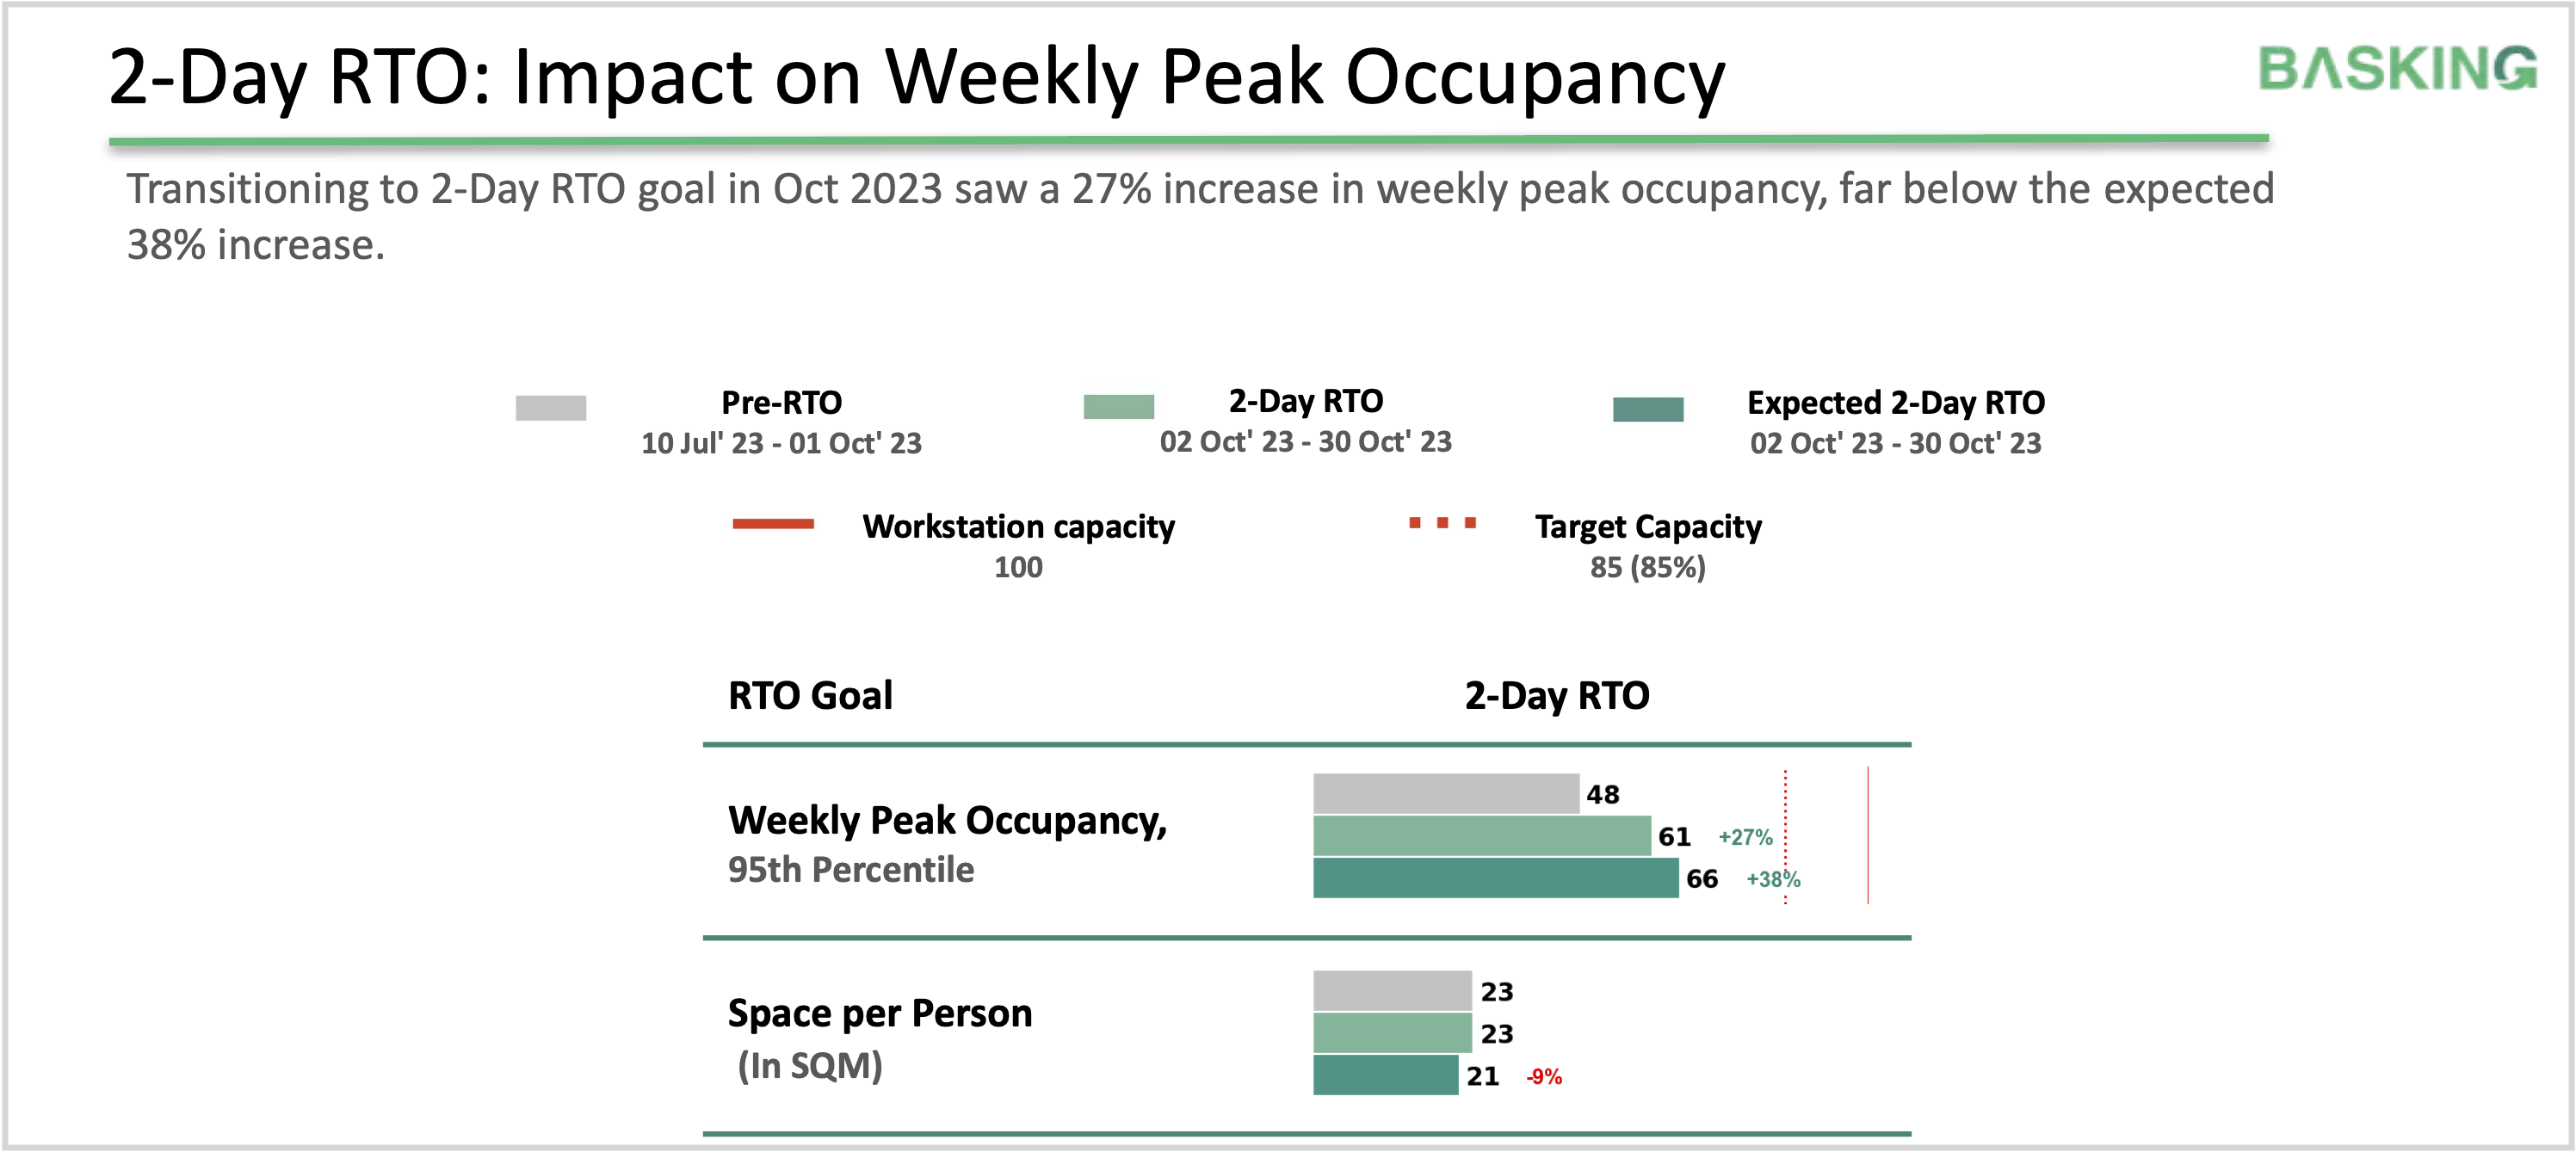
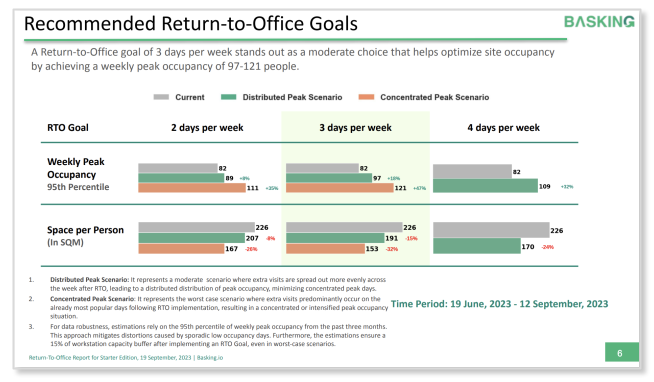
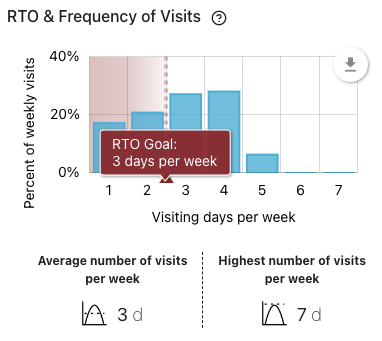
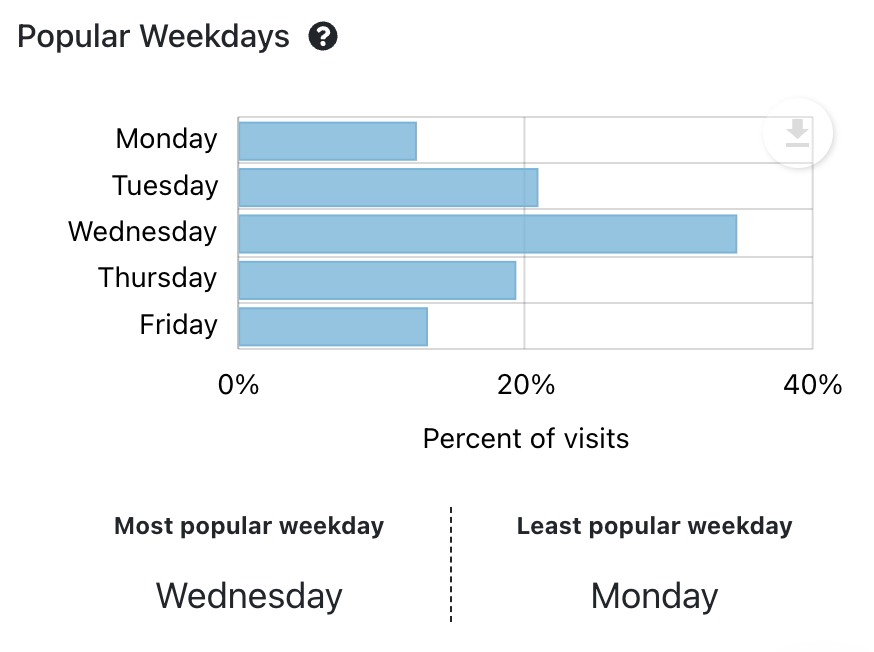
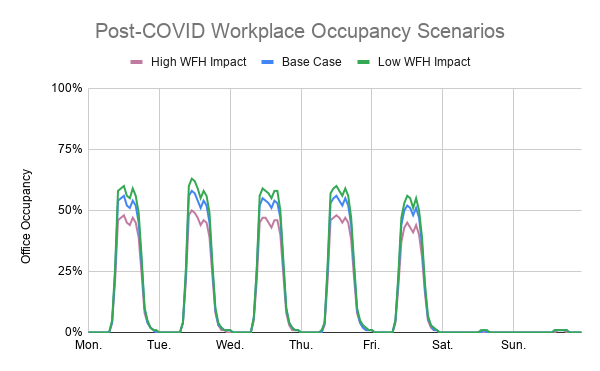
OVI was developed in response to the trend of higher occupancy on popular weekdays, leading to overcrowding mid-week and underutilization on Mondays and Fridays. This challenge has been exacerbated by RTO mandates specifying 2-3 days of office presence per week. By quantifying occupancy management efficiency across different weekdays, OVI becomes an indispensable tool in adapting to the fluid nature of modern workspaces.
GLOBAL OCCUPANCY VARIANCE INDEX (OVI) – 2023 YTD
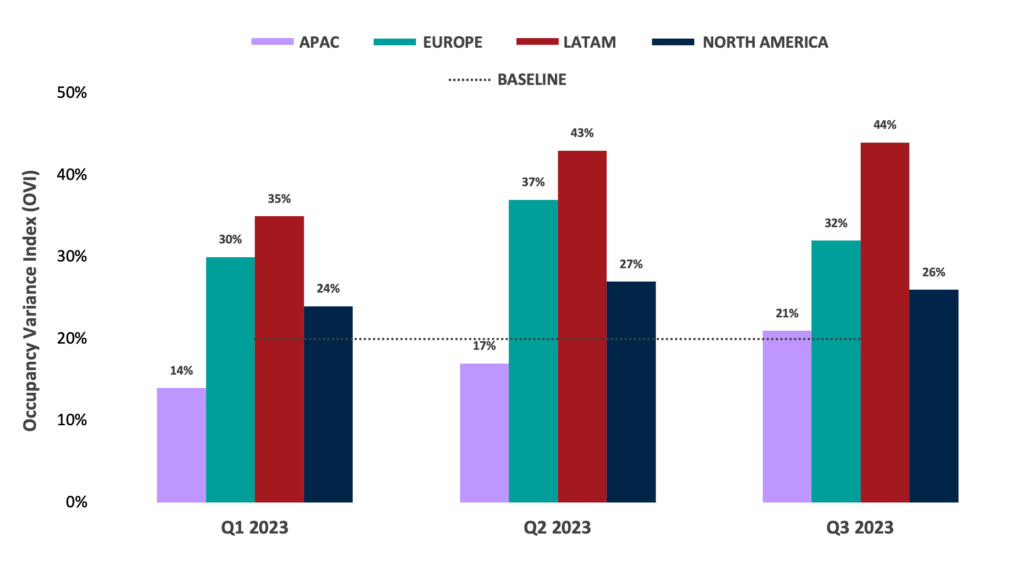
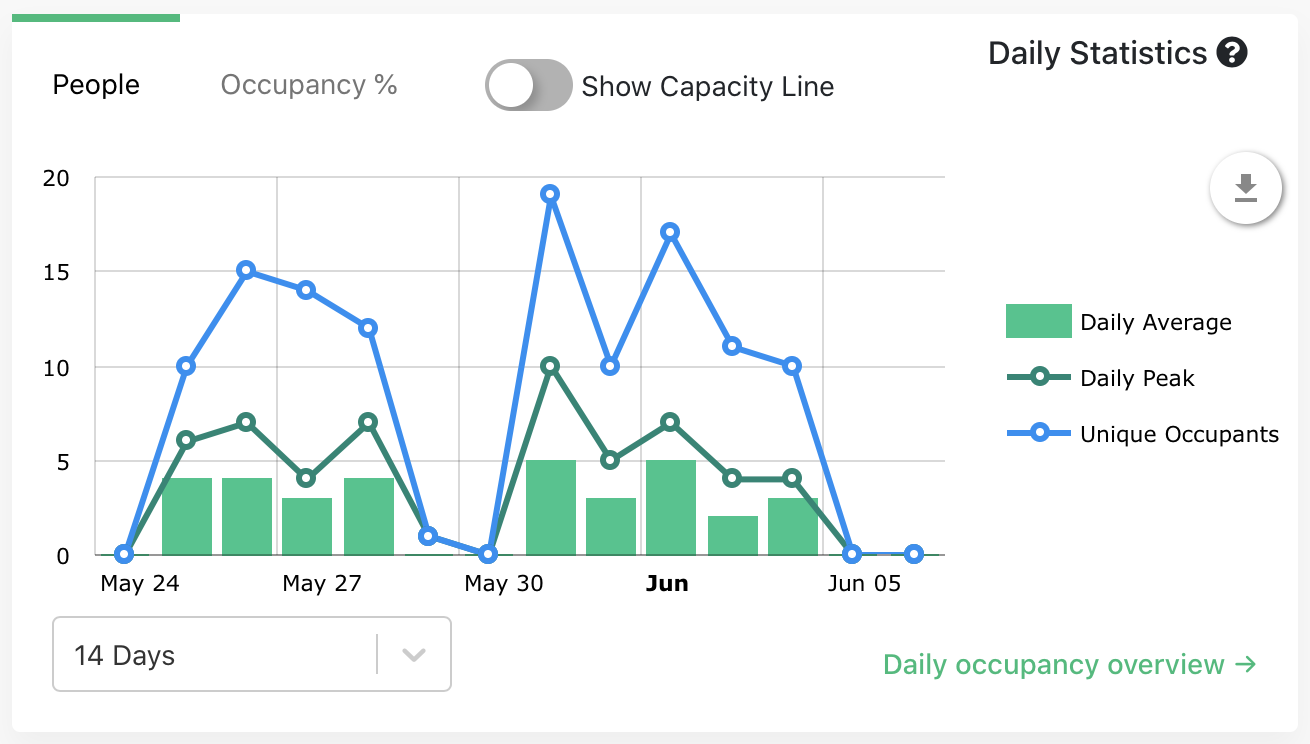
Calculated as the relationship between the standard weekday deviation of peak occupancy and the average peak occupancy for the entire week, OVI offers valuable insights into the weekly distribution of office occupancy. A high OVI correlates with high variability, with <20% the baseline for a well-distributed occupancy across the week.
Understanding this variability in addition to traditional usage metrics equips you to make informed decisions about your business strategy and portfolio management. What is your margin between peak occupancy and capacity, and can you work with team leaders to smooth those peaks? If your employees ask for more space, do they need square footage or room to collaborate?
Ready access to this metric and data trendlines provides confidence beyond planning sessions, empowering organizations to communicate effectively with their employees regarding utilization or perceived over/under crowding, align on next steps, and track progress toward identified goals. This level of functional insight also supports sustainability efforts, surfacing opportunities to conserve resources and reduce expenses with minimal impact on experience.


