2023 Global Occupancy Benchmarks: Looking Back, Looking Ahead


“We’re looking closely in order to really ensure that people are coming into the office, [but] they have to still be able to find value when it doesn’t support the work when they’re in the office. […] So you have to take into account so many different variables when you’re thinking about, what do people need and want when they come into the office?”
– Kate North | Principal – Workplace Innovation & Transformation, Global Workplace Analytics
Look at the occupancy numbers for 2023, or around any office across the globe, and it is clear hybrid is the future of work. While there are significant variances for industry and region, the challenge for workplace management now is making hybrid work—for the organization and the employees.
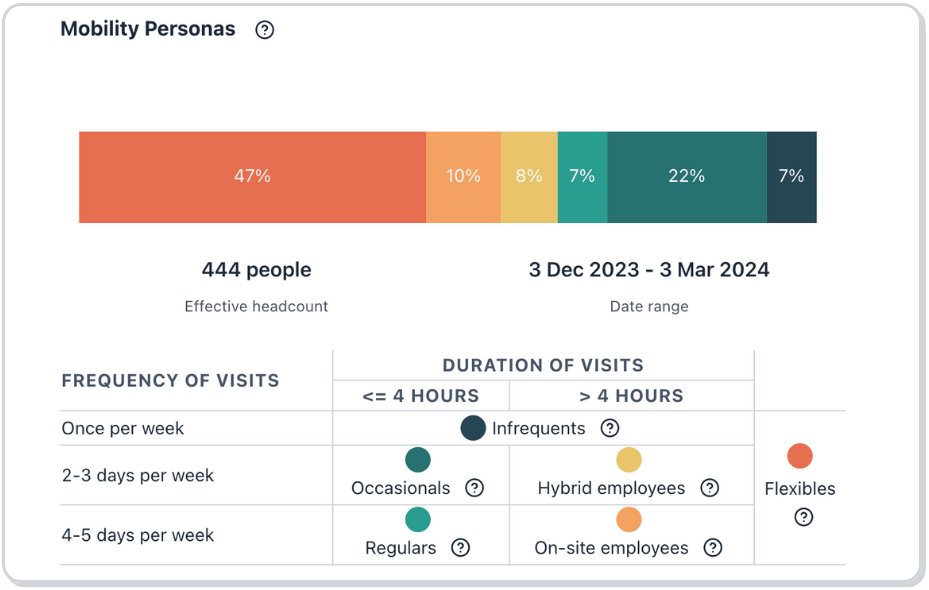
While they didn’t increase occupancy, mandates did impact employee behavior. Understanding workplace norms and mobility personas can create opportunities for improving sustainability and culture as well as cost savings. How can CRE professionals leverage that data to make informed decisions about strategy, engagement, and innovation?
Key Findings
- Not only did RTO mandates NOT result in a surge in occupancy rates, but occupancy rates flattened globally
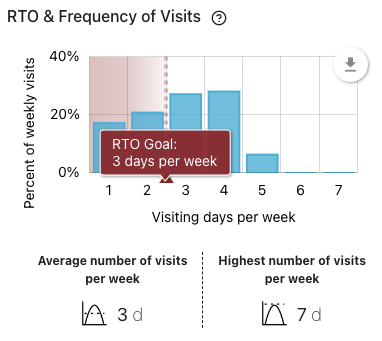
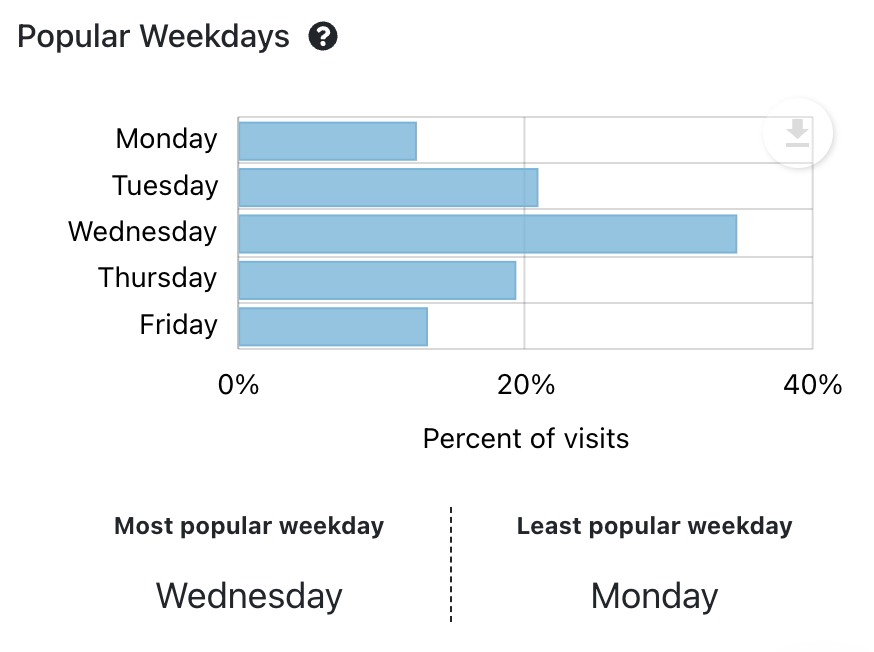
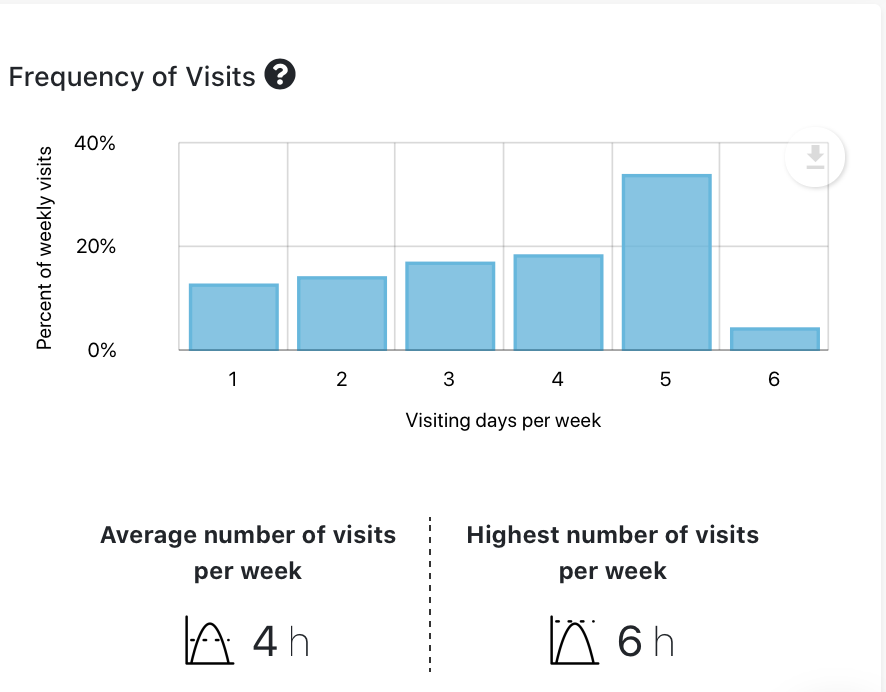
- Once a week and task-specific visits in the office remain dominant, while challenging mid-week peaks and “empty office syndrome” on Fridays persist
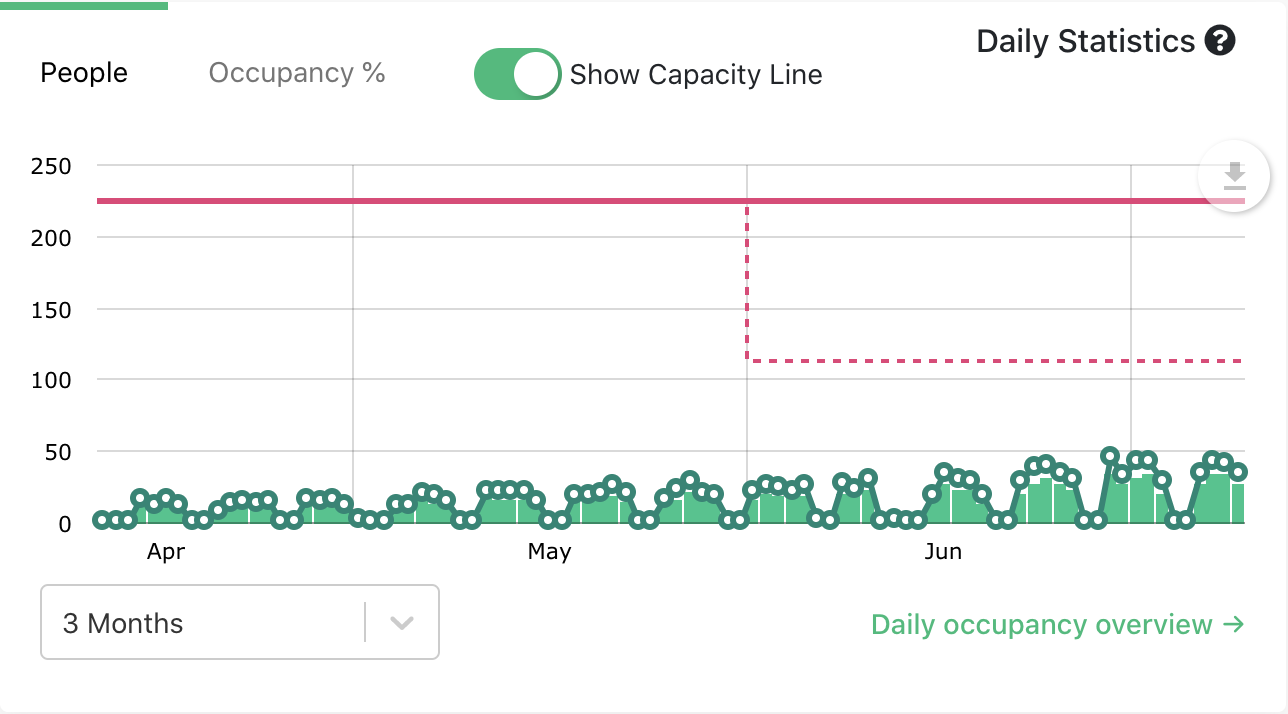
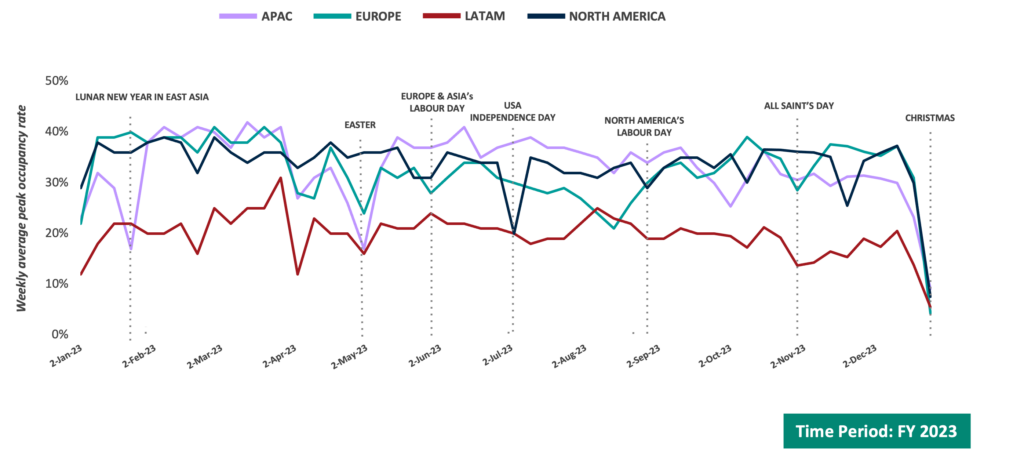
Occupancy Rates Stabilized in 2023
In FY 2023, the occupancy rates flattened across all regions.
North America had the highest weekly average peak occupancy rate at 34%, followed by APAC (33%), Europe (32%), and LATAM (20%).
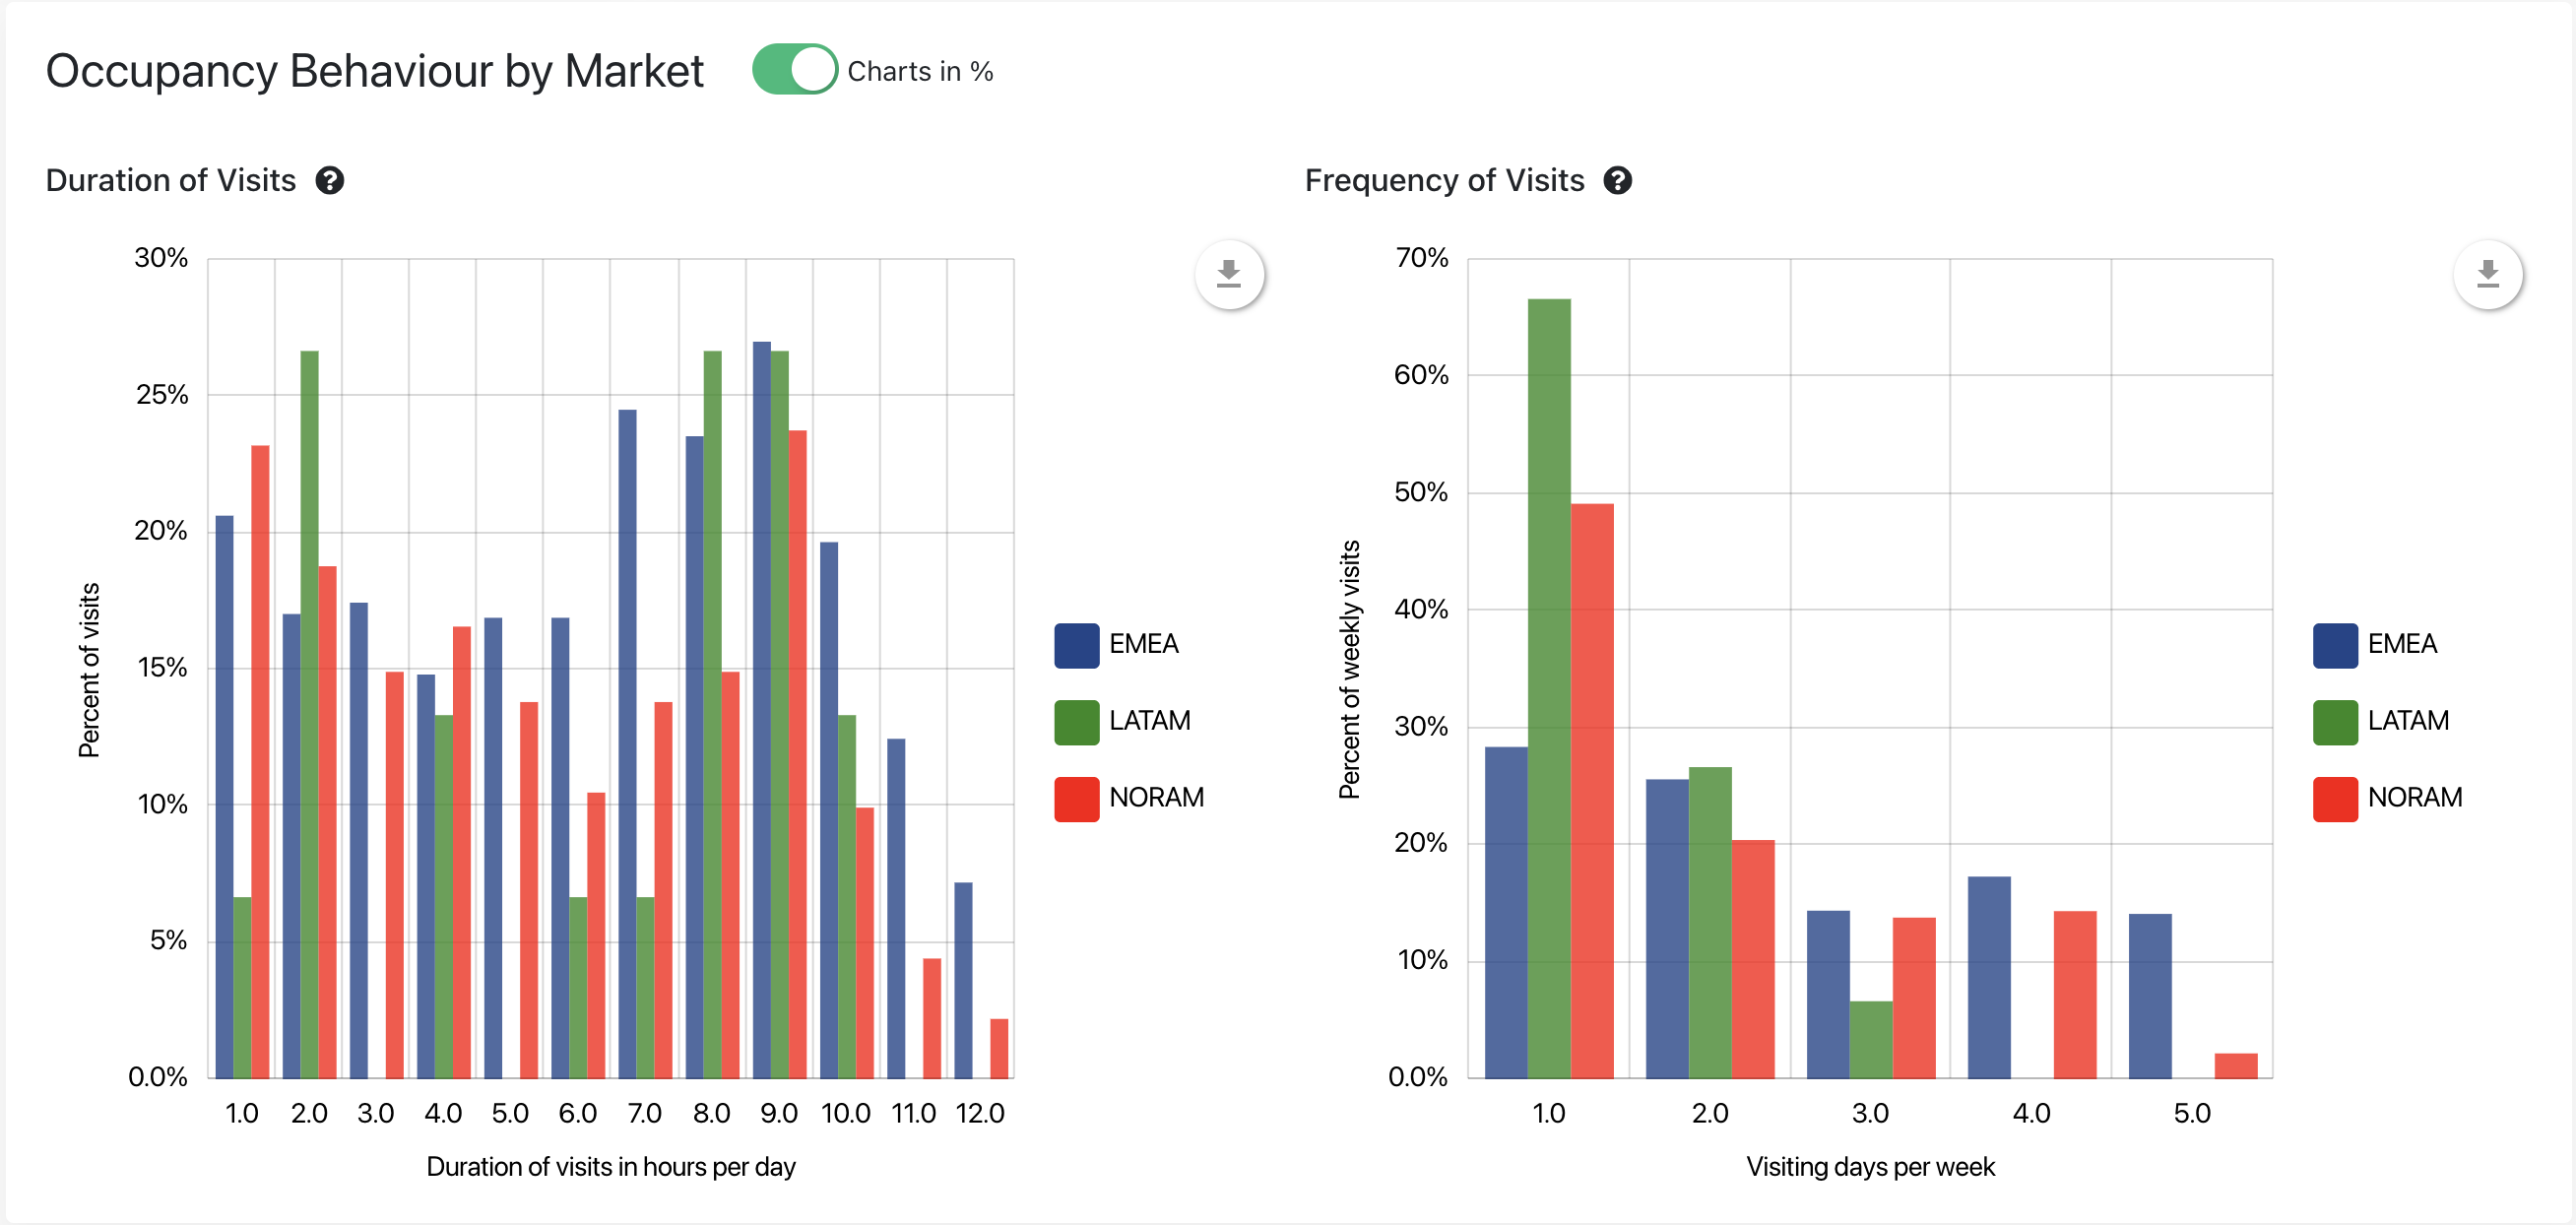
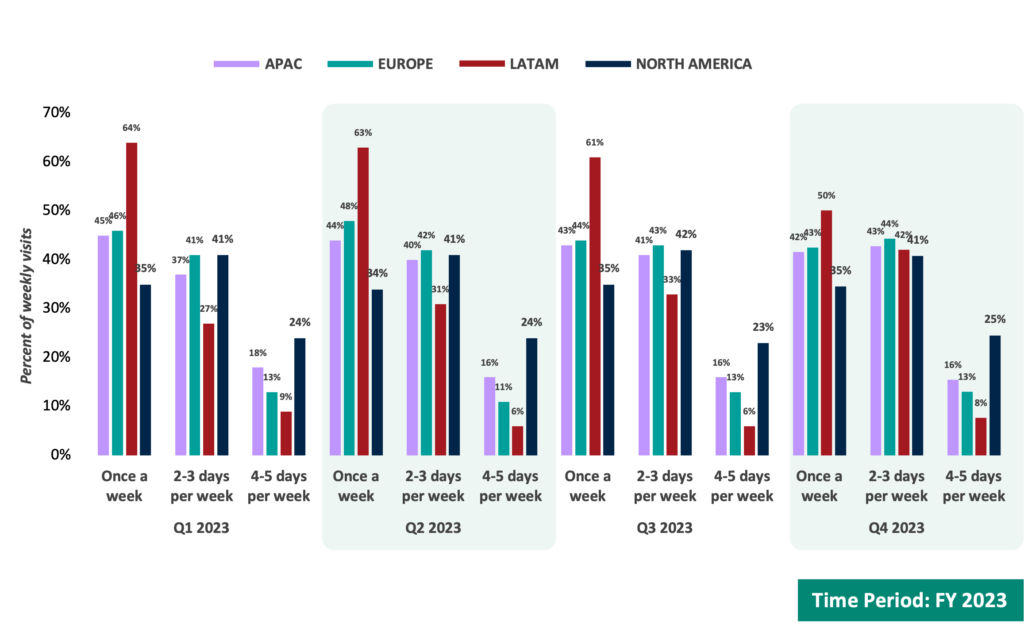
LATAM Frequency of Office Visits Increased 27% QoQ
The frequency of office visits remained consistent each quarter across APAC, Europe, and North America.
However, LATAM observed a 9 pp increase in the “2-3 days per week” category in Q4 compared to Q3, indicating more frequent office visits in the region.
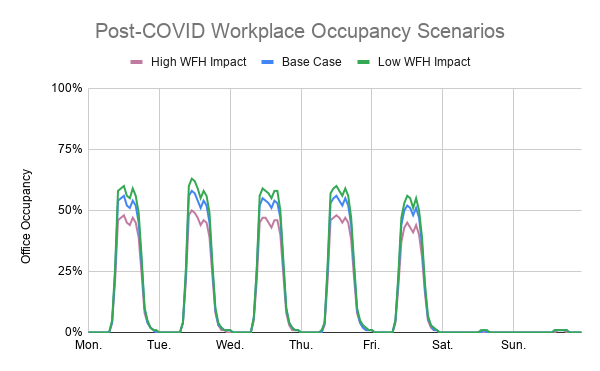
Low OVI* in North America and APAC Indicates Stable Occupancy Across Weekdays
APAC consistently maintained the lowest OVI throughout the year, averaging below 20%, indicating minimal effort in weekly occupancy management.
In contrast Europe consistently exceeded 30% OVI in each quarter, highlighting the necessity to reduce midweek peaks and better distribute occupancy—especially on Mondays and Fridays.
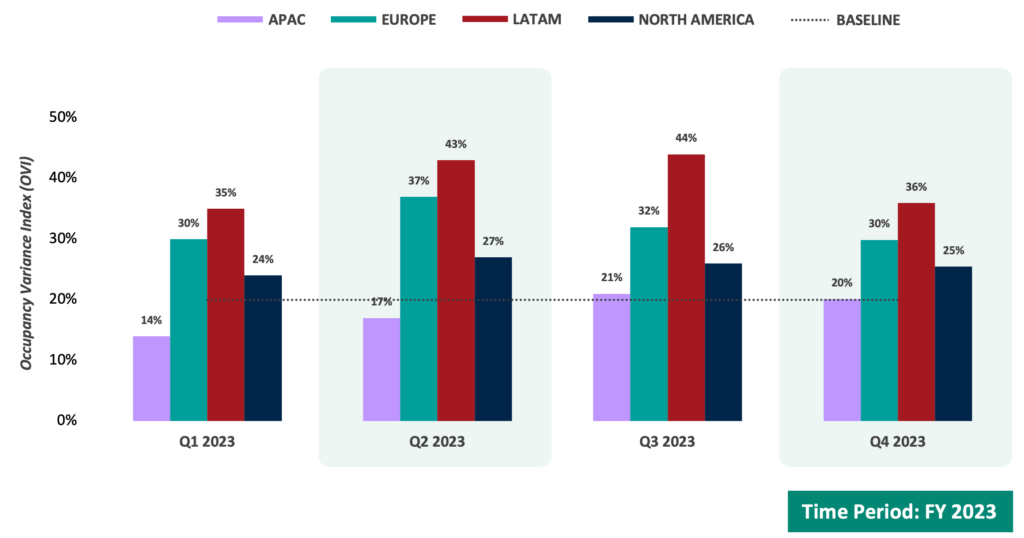
* The Occupancy Variance Index (OVI) offers valuable insights into the weekly distribution of office visits. It is calculated as the Standard Deviation of the Weekly Percentage of Visits divided by the Average Percentage of Visits. A high OVI indicates significant variability in occupancy throughout the week, while a low OVI suggests stability.
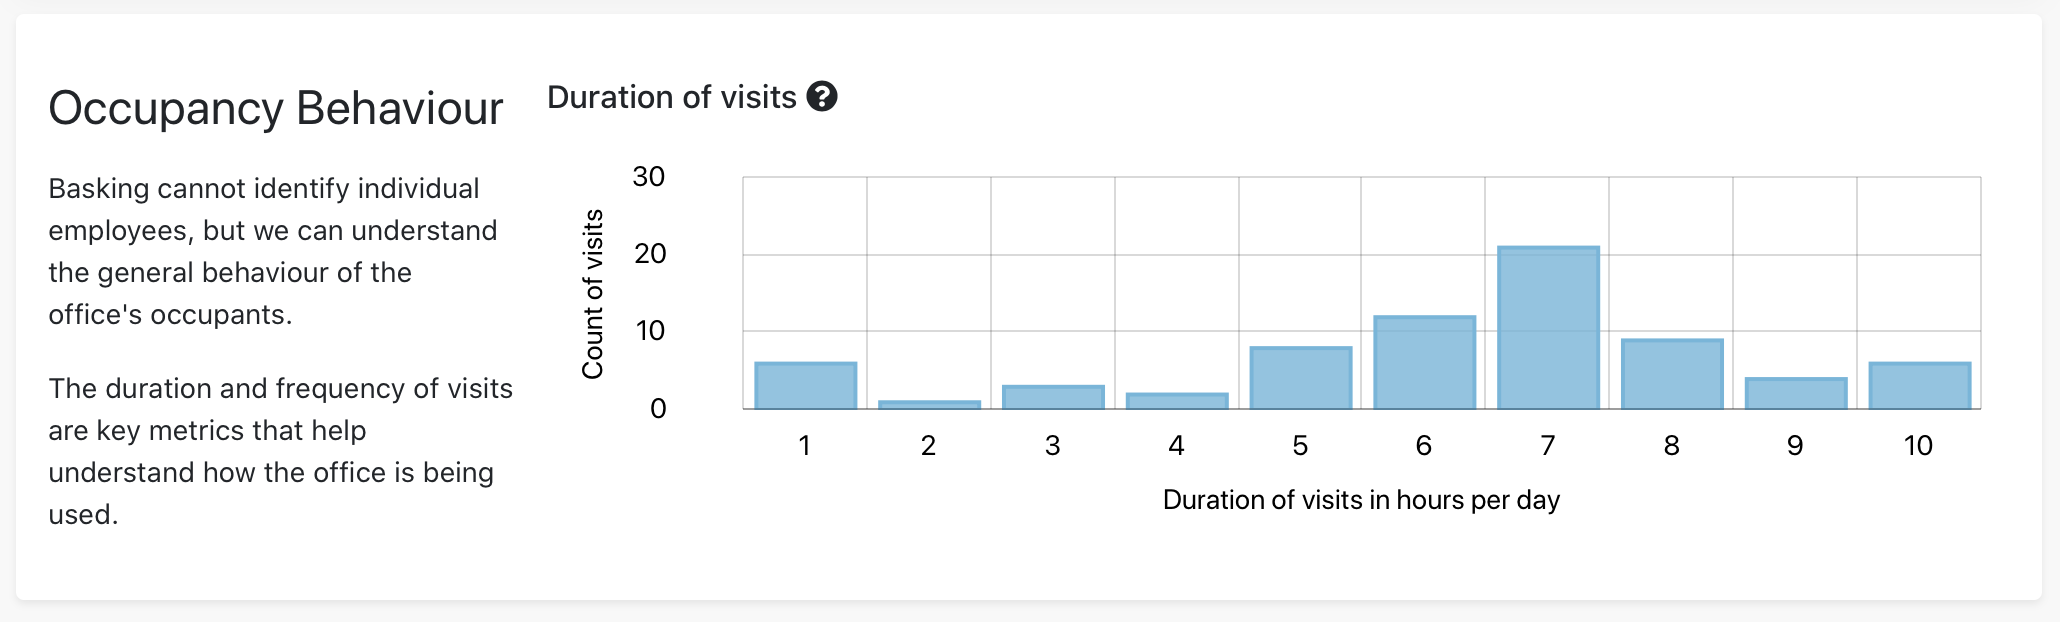
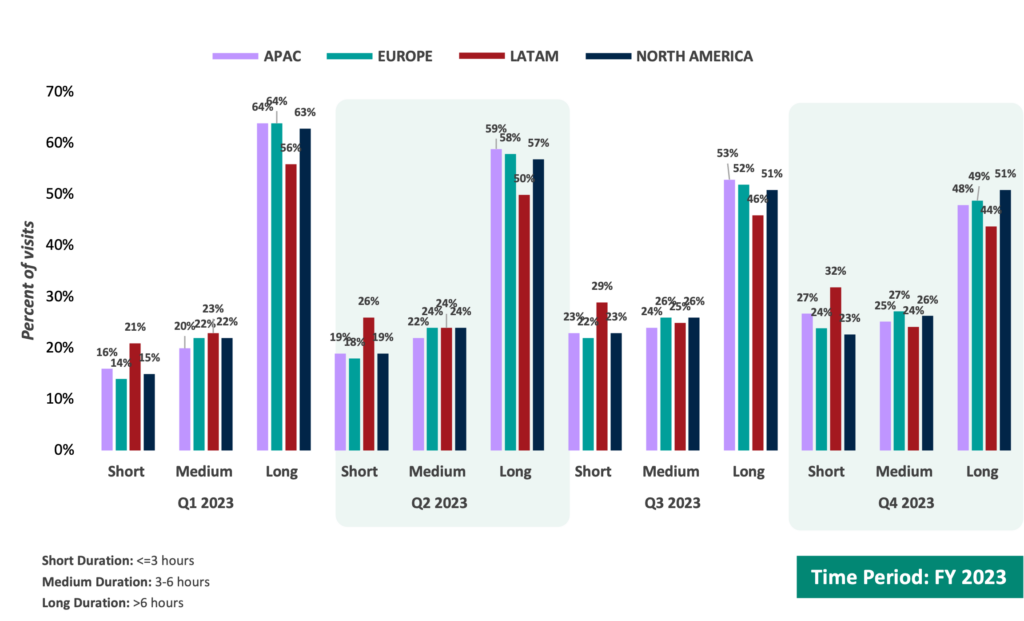
Long Duration Stays Declined by >24% From Q1 to Q4
Quarter by quarter, each region experienced a consistent decline in the number of long duration visits. Consequently, there has been an uptick in short to medium-duration visits.
Check out the full Q4 2023 Basking Global Occupancy Benchmarks Report to understand trends by region and explore strategic opportunities for empowering CRE success. For a deeper dive into the data and key insights, don’t miss our 2023 Benchmarks Webinar with Kate North, Principal – Workplace Innovation & Transformation for Global Workplace Analytics.
Contact us to learn how we can help you assess your occupancy and maximize flexibility to support your utilization strategy.