Q2 2023 Global Occupancy Benchmarks | The Future of Work: Embracing Opportunities, Redefining Success
Return-to-office policies continue to evolve as organizations navigate the still-changing occupancy dynamics of hybrid work and post-pandemic office life. Whether prepping for a September RTO wave or assessing your overall CRE strategy, understanding the current state of occupancy across regions is a strategic advantage in determining the next steps for portfolio and policy.
The quarterly Basking Global Occupancy Benchmarks Report takes you beyond the numbers, with a deep understanding of making the workspace work through analytics and data-driven strategy. Even before the pandemic around 40% of office space remained unutilized, underscoring the need for optimization—leveraging these insights to enhance the employee experience, achieve cost savings, and foster a sustainable workplace.
Key Findings
- North America Leads Global Office Occupancy: In the first half of 2023, North America recorded the highest weekly average peak occupancy rate at 35%, with APAC following closely at 34% and Europe at 33%.
- Consistent Office Usage Trends: Since Q1 2023, global office usage patterns have remained steady. Office visits once a week were prevalent in every region, with LATAM leading at 63%, and midweek visits (T/W/Th) widespread across all regions.
- Regional Variations Impact Office Utilization: Regional trends exhibit notable variances, suggesting influences from factors such as commute time, public transport availability, and employee job roles on office space utilization. For example, North America’s Midwestern region registered the highest weekly occupancy rate, with nearly half of the visits lasting less than 6 hours, diverging from the traditional “8-hours in office” norm.
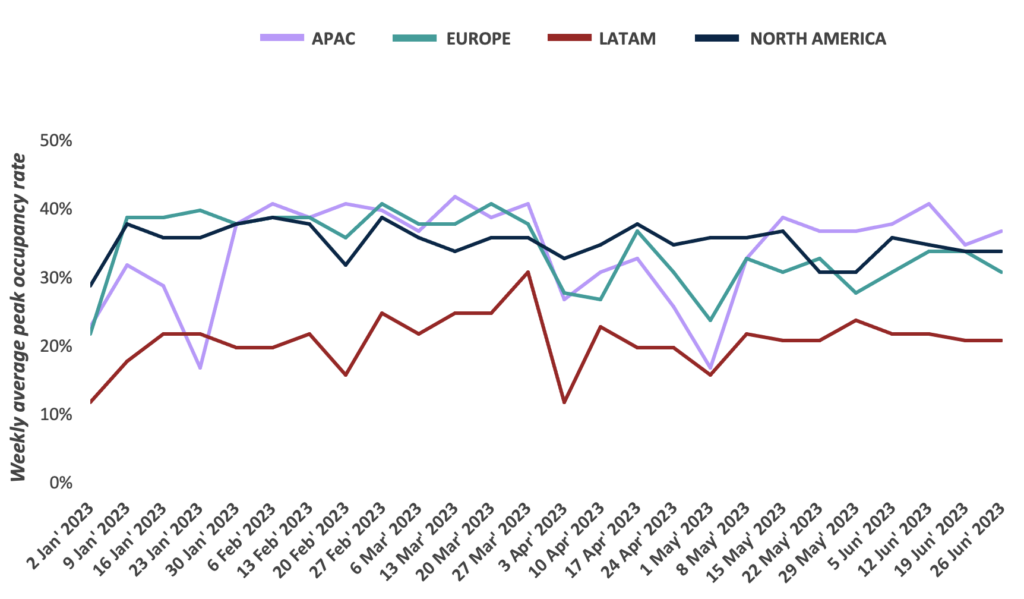
Weekly Occupancy Rates Steady At 35%-40%
From January to June 2023, North America had the highest weekly average peak occupancy rate of 35%, followed by APAC (34%), Europe (33%), and LATAM (21%).
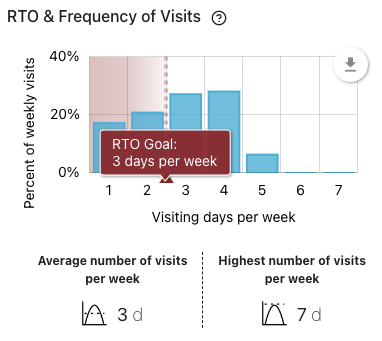
23% Higher Office Visit Frequency In North America
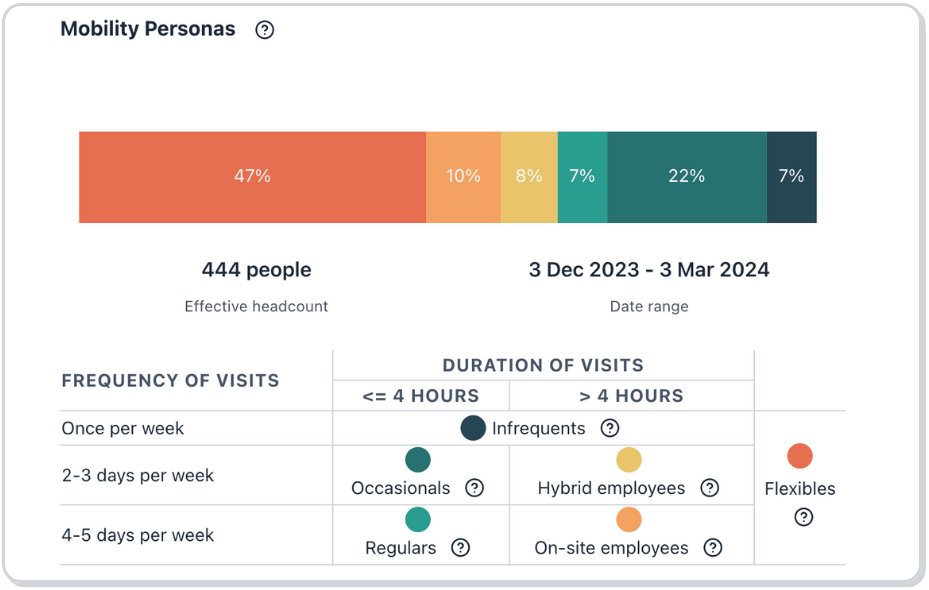
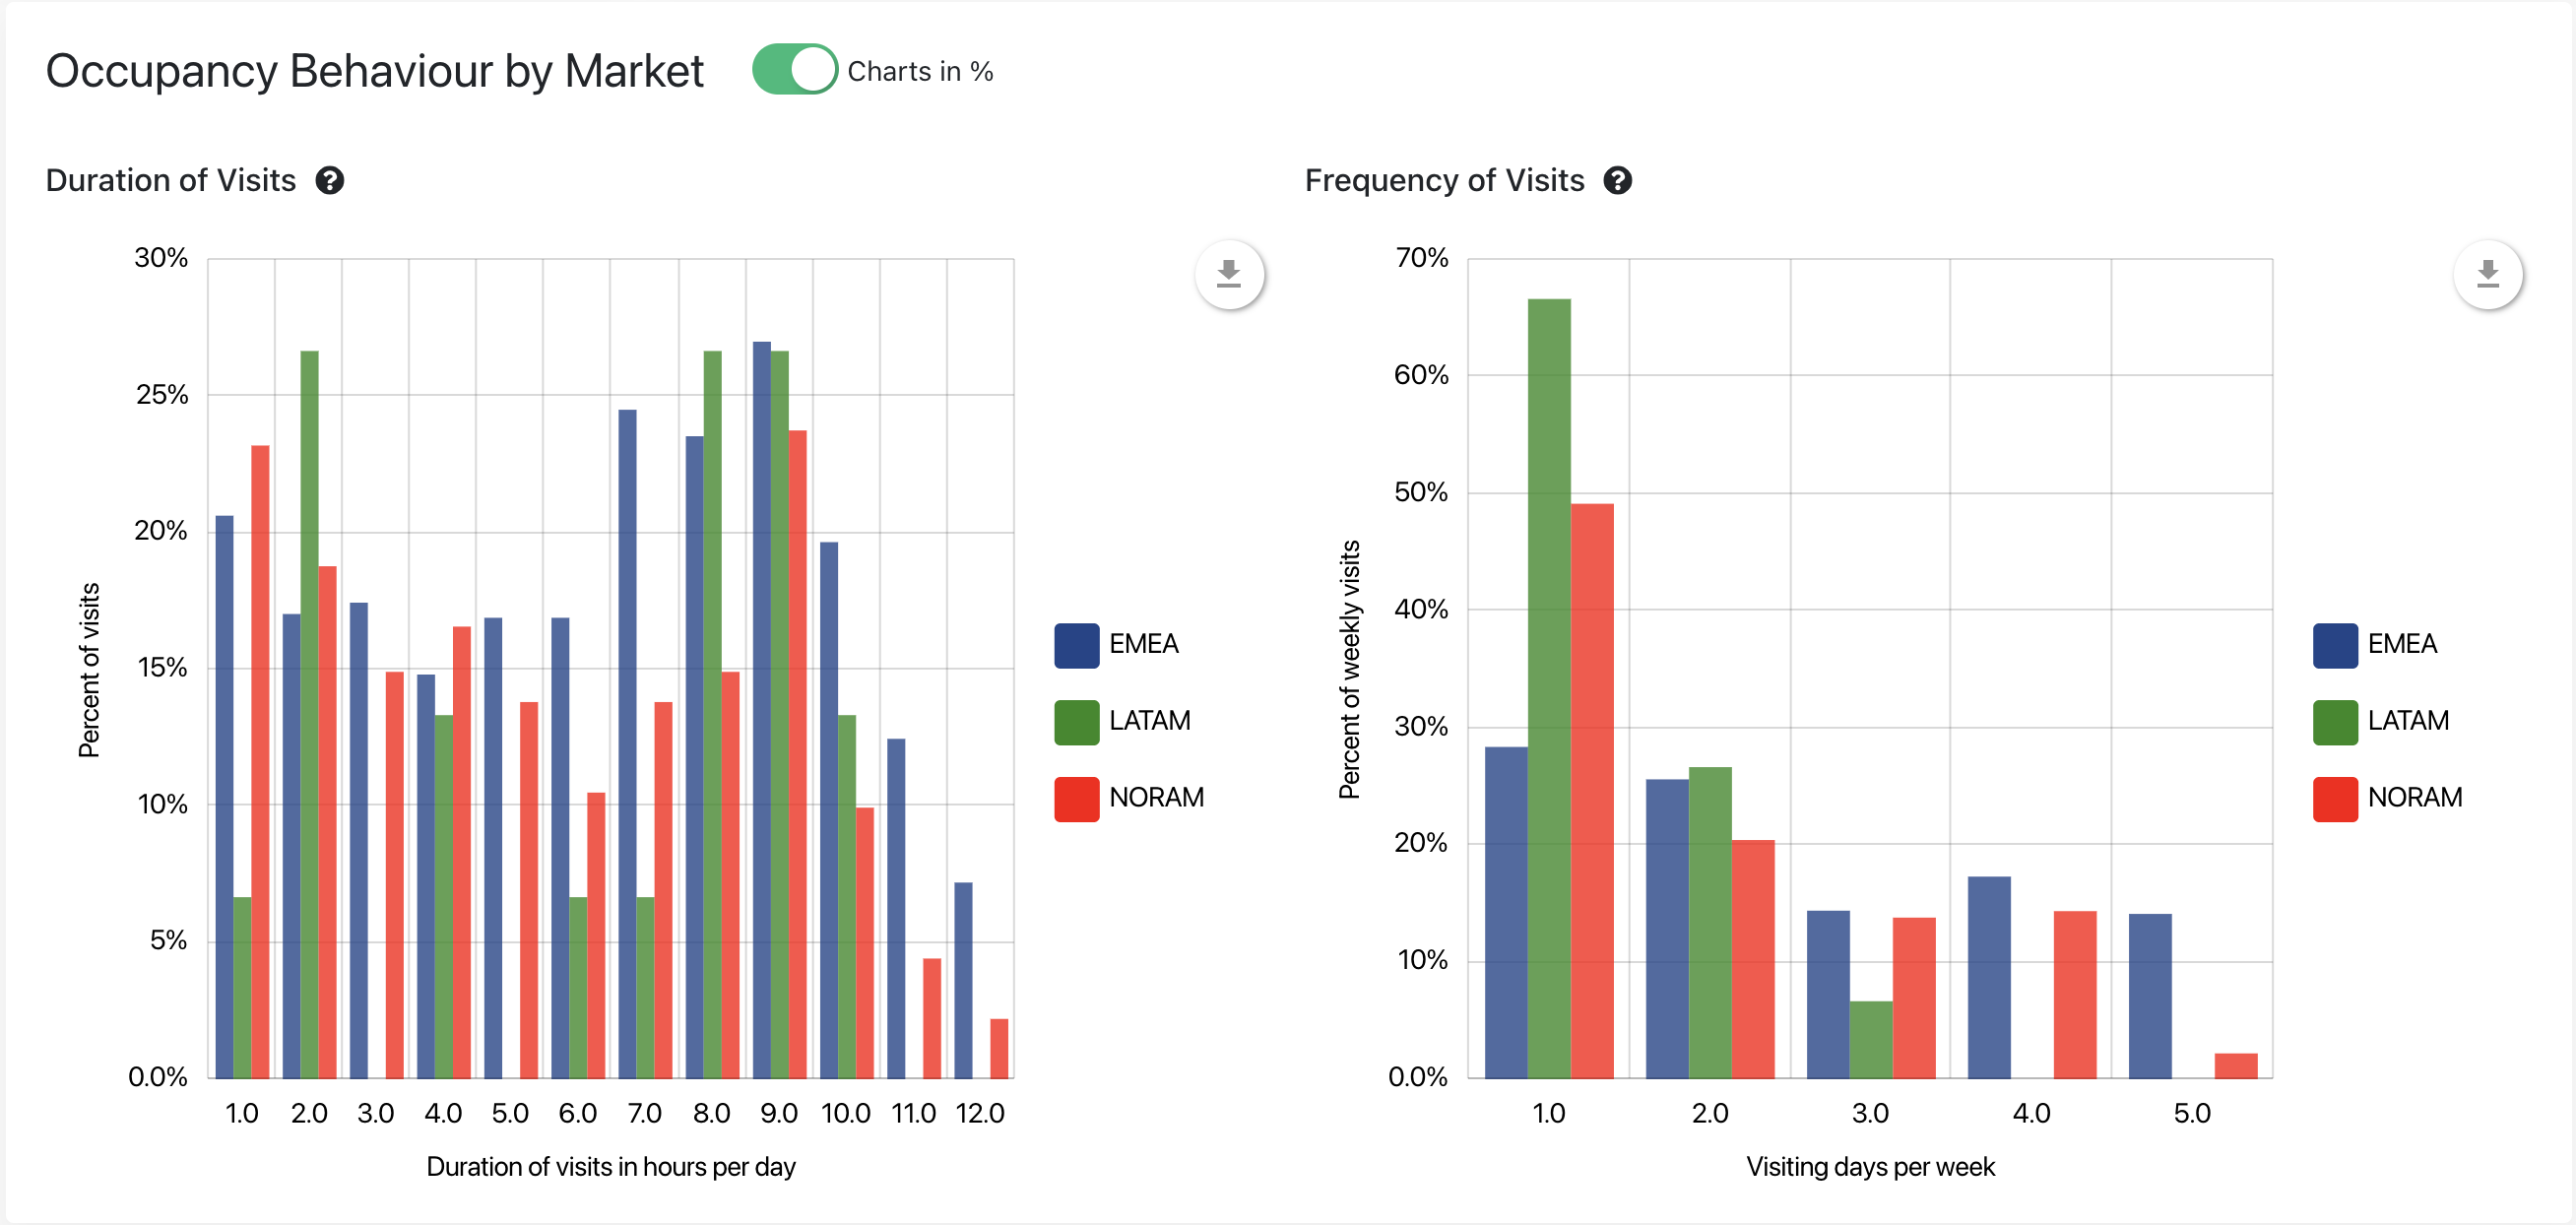
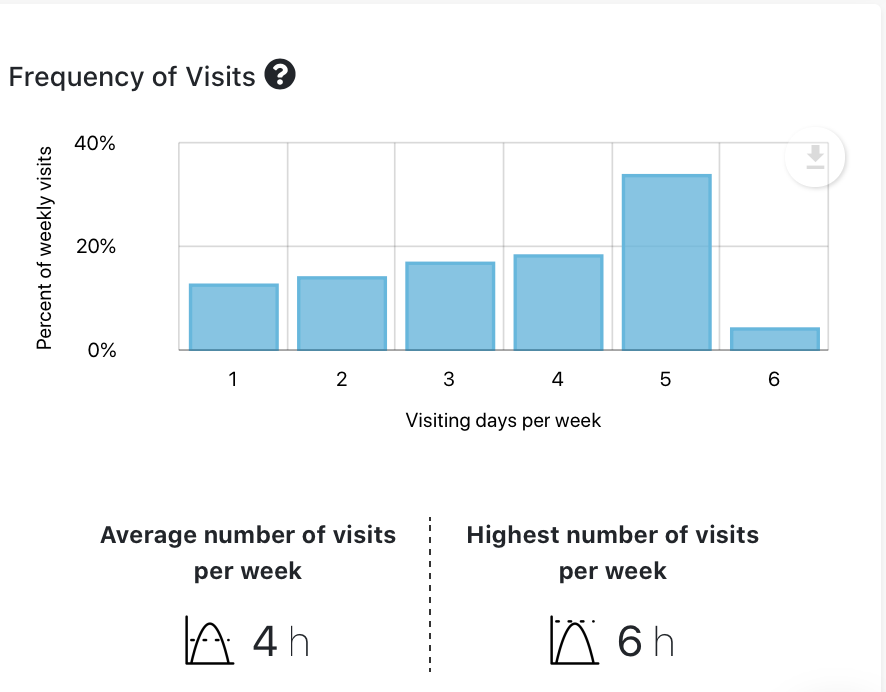
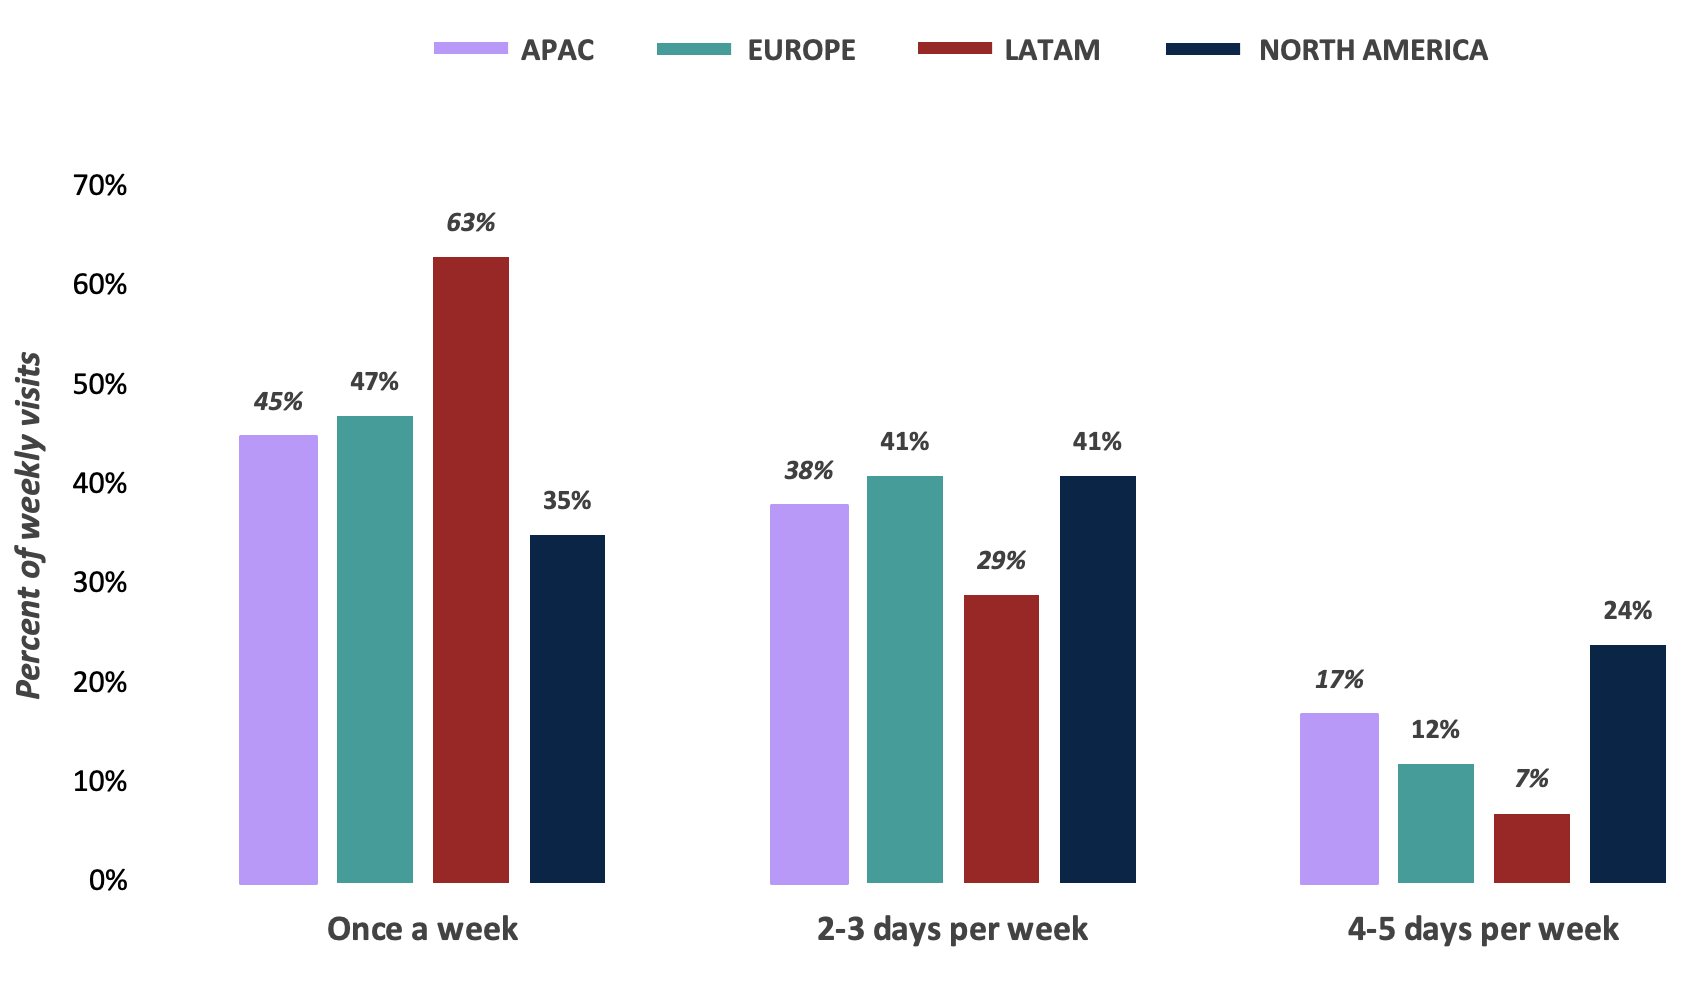
North America exhibited the highest frequency of office visitors, with an impressive 65% of weekly visits occurring on at least 2 days per week, surpassing other regions.
In LATAM, office visits were primarily concentrated on a weekly basis (63%), with a mere 7% of visits occurring 4-5 days per week, illustrating a distinctive contrast to the frequency patterns observed in other regions.
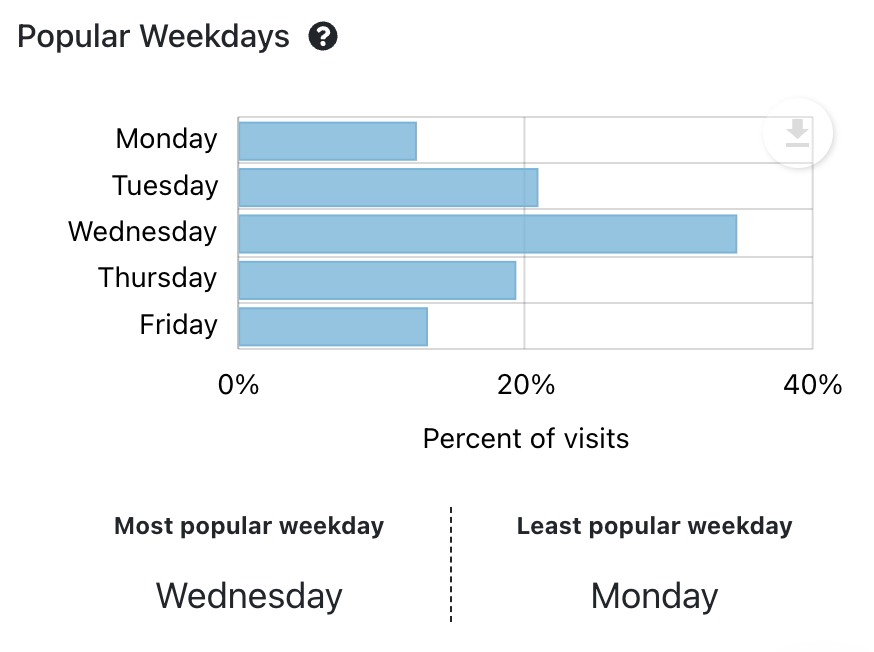
High Occupational Variance Index (OVI) Indicates Need For Midweek Peak Management
LATAM demonstrated the highest OVI* of 39%, with Thursdays experiencing a remarkable 40% higher occupancy compared to the average across weekdays.
Europe followed closely with the second highest OVI of 39% as Mondays, Tuesdays, and Wednesdays observed 31%, 21%, and 16% higher occupancy, respectively, compared to the average across weekdays.
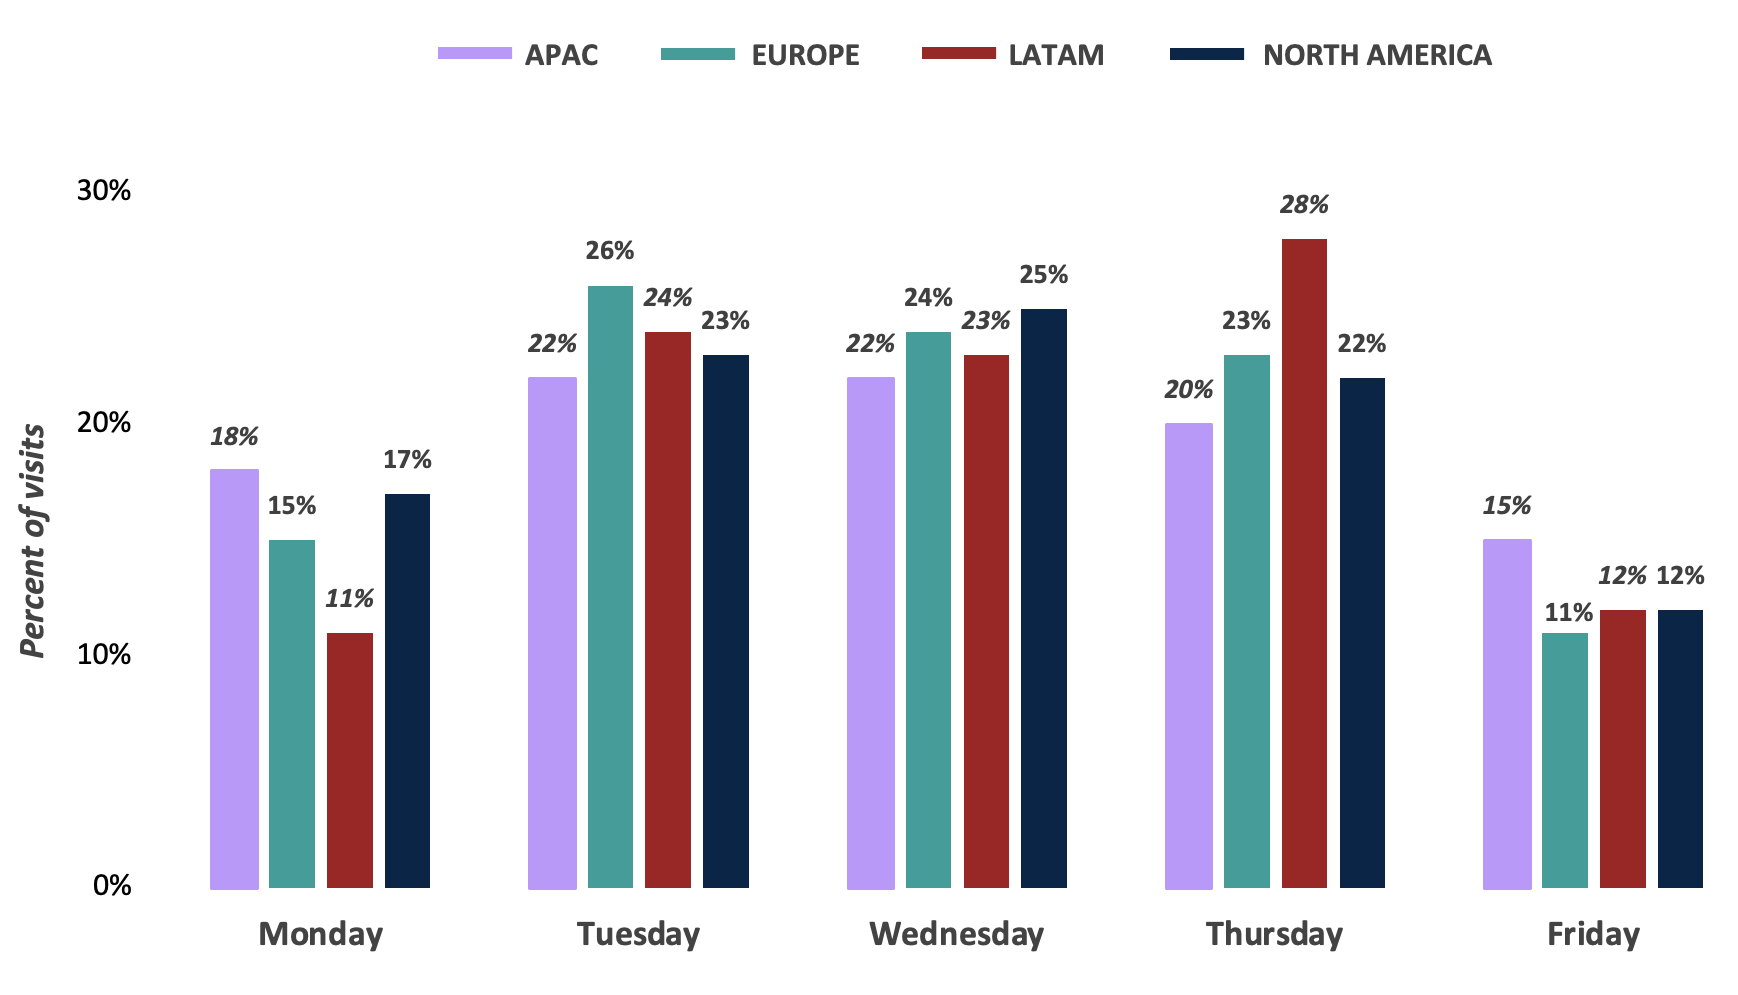
* The Occupancy Variance Index (OVI) offers valuable insights into the weekly distribution of office visits. It is calculated as the Standard Deviation of the Weekly Percentage of Visits divided by the Average Percentage of Visits. A high OVI indicates significant variability in occupancy throughout the week, while a low OVI suggests stability.
Longer Duration of Visits Continue to Prevail Across All Regions
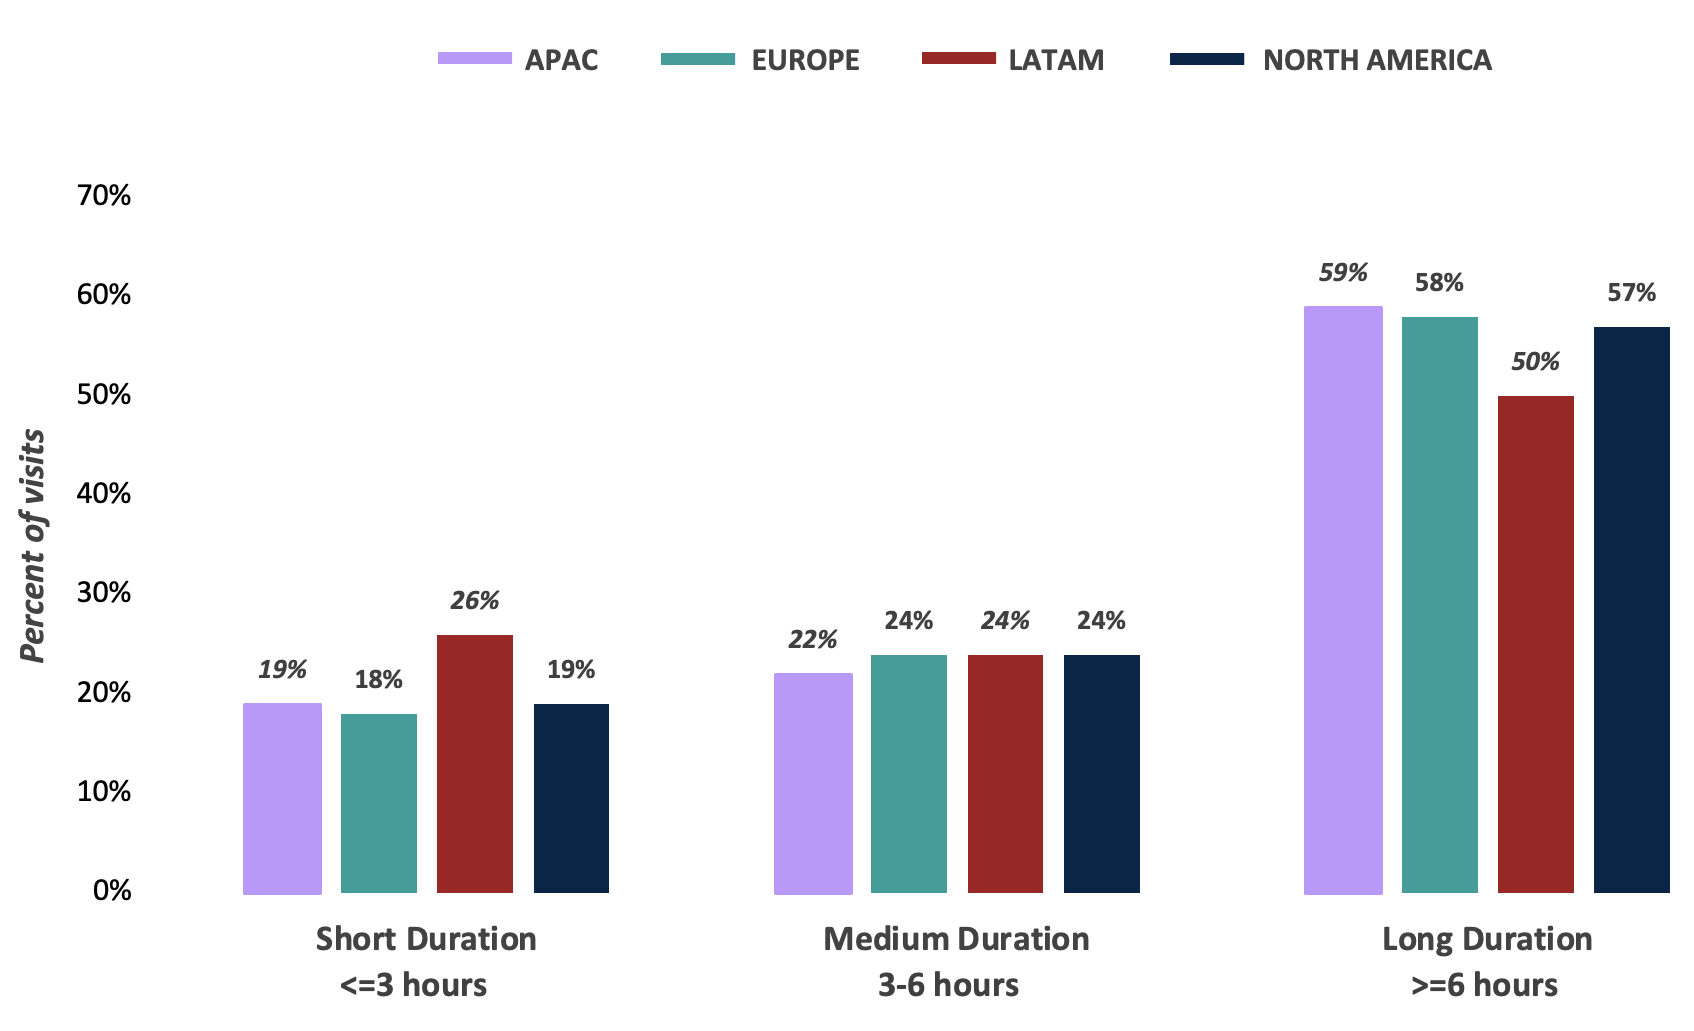
The majority of visits lasted for more than 6 hours, ranging between 50% to 59%. Notably, LATAM exhibited the highest percentage of visits lasting for less than 4 hours, accounting for 26% of the total visits.
Check out the full Q2 Basking Global Occupancy Benchmarks Report to understand trends by region and explore strategic opportunities for empowering CRE success, and don’t miss our webinar that dives deeper into the data and key insights. Contact us to learn more about how we can help you achieve success in 2023 and beyond.


