[Q3 2023 Global Occupancy Benchmarks] The State of RTO: Finding a New Equilibrium
“This is not the first structural change we’ve gone through in the industry; [when we went from one-person offices to cubicles] we started to reduce the individual footprint and move towards the “we” or the collaboration. Now you’re moving to a two-to-one ratio, a trend that’s been happening over the last 15 years and that we will continue to see even more.”
– Tiffany English, Senior Director of Architecture at Qualcomm
In the midst of the current structural changes in workplace behaviors and attitudes, data is essential to understand and make decisions on how to best optimize the office environment moving forward. A clear, accurate picture of how the office space is used allows for transparency and intentionality among stakeholders, from the executive team to building and team leads.
In addition, Return-to-Office goals and mandates have to balance the employee experience with space and resource optimization while accounting for the regional and cultural differences that inform many of the variations. The Basking team has analyzed office utilization metrics for sites across the globe, compiling valuable insights on these shifts and variations in workplace occupancy patterns.
Key Findings
- While weekly average peak occupancy rates are similar across the regions, the behaviors within reflect a wider range of regional and cultural differences
- Office usage trends are stable across 2023 with once-a-week visits still dominant, demonstrating a consistency that mandates consideration
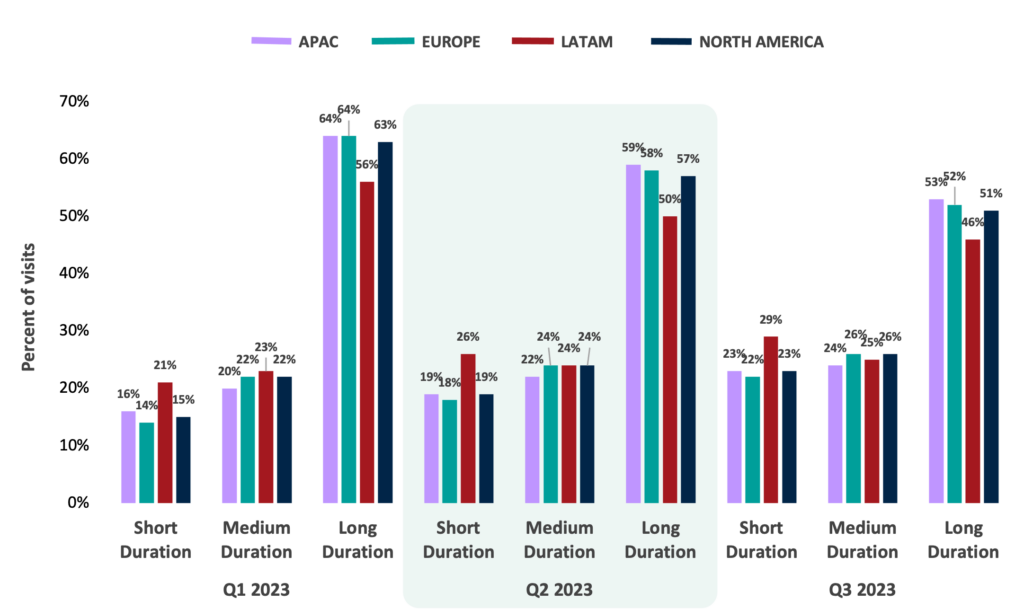
- A drop in long-duration stays suggests a shift to more pre-meditated or task-specific visits that “earn the commute”
- Regional factors exert significant influence, such as commute time, public transport availability, employee job roles, and culture-specific approaches to in-office presence
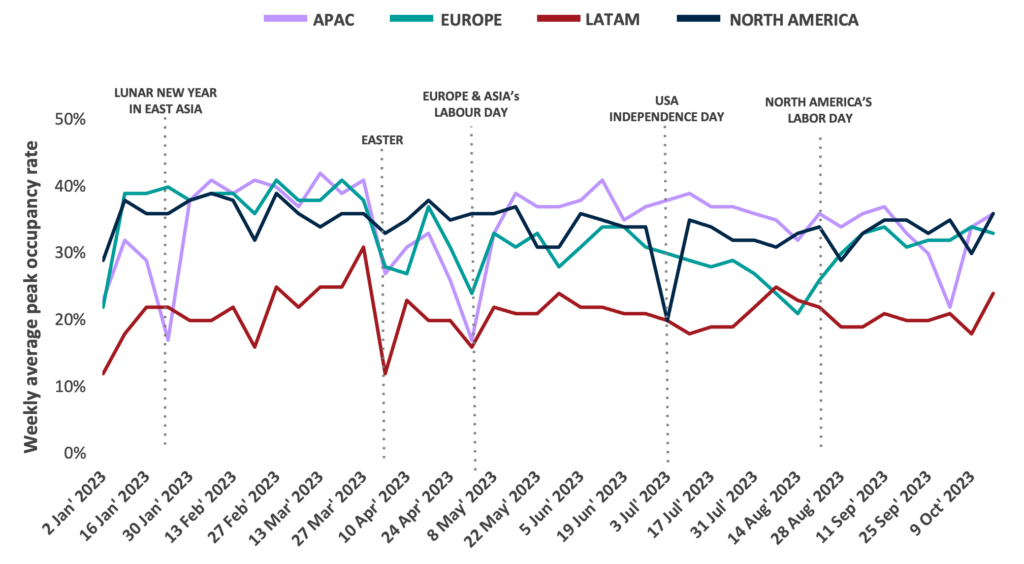
Weekly Occupancy Rates Stabilized At 35%-40%
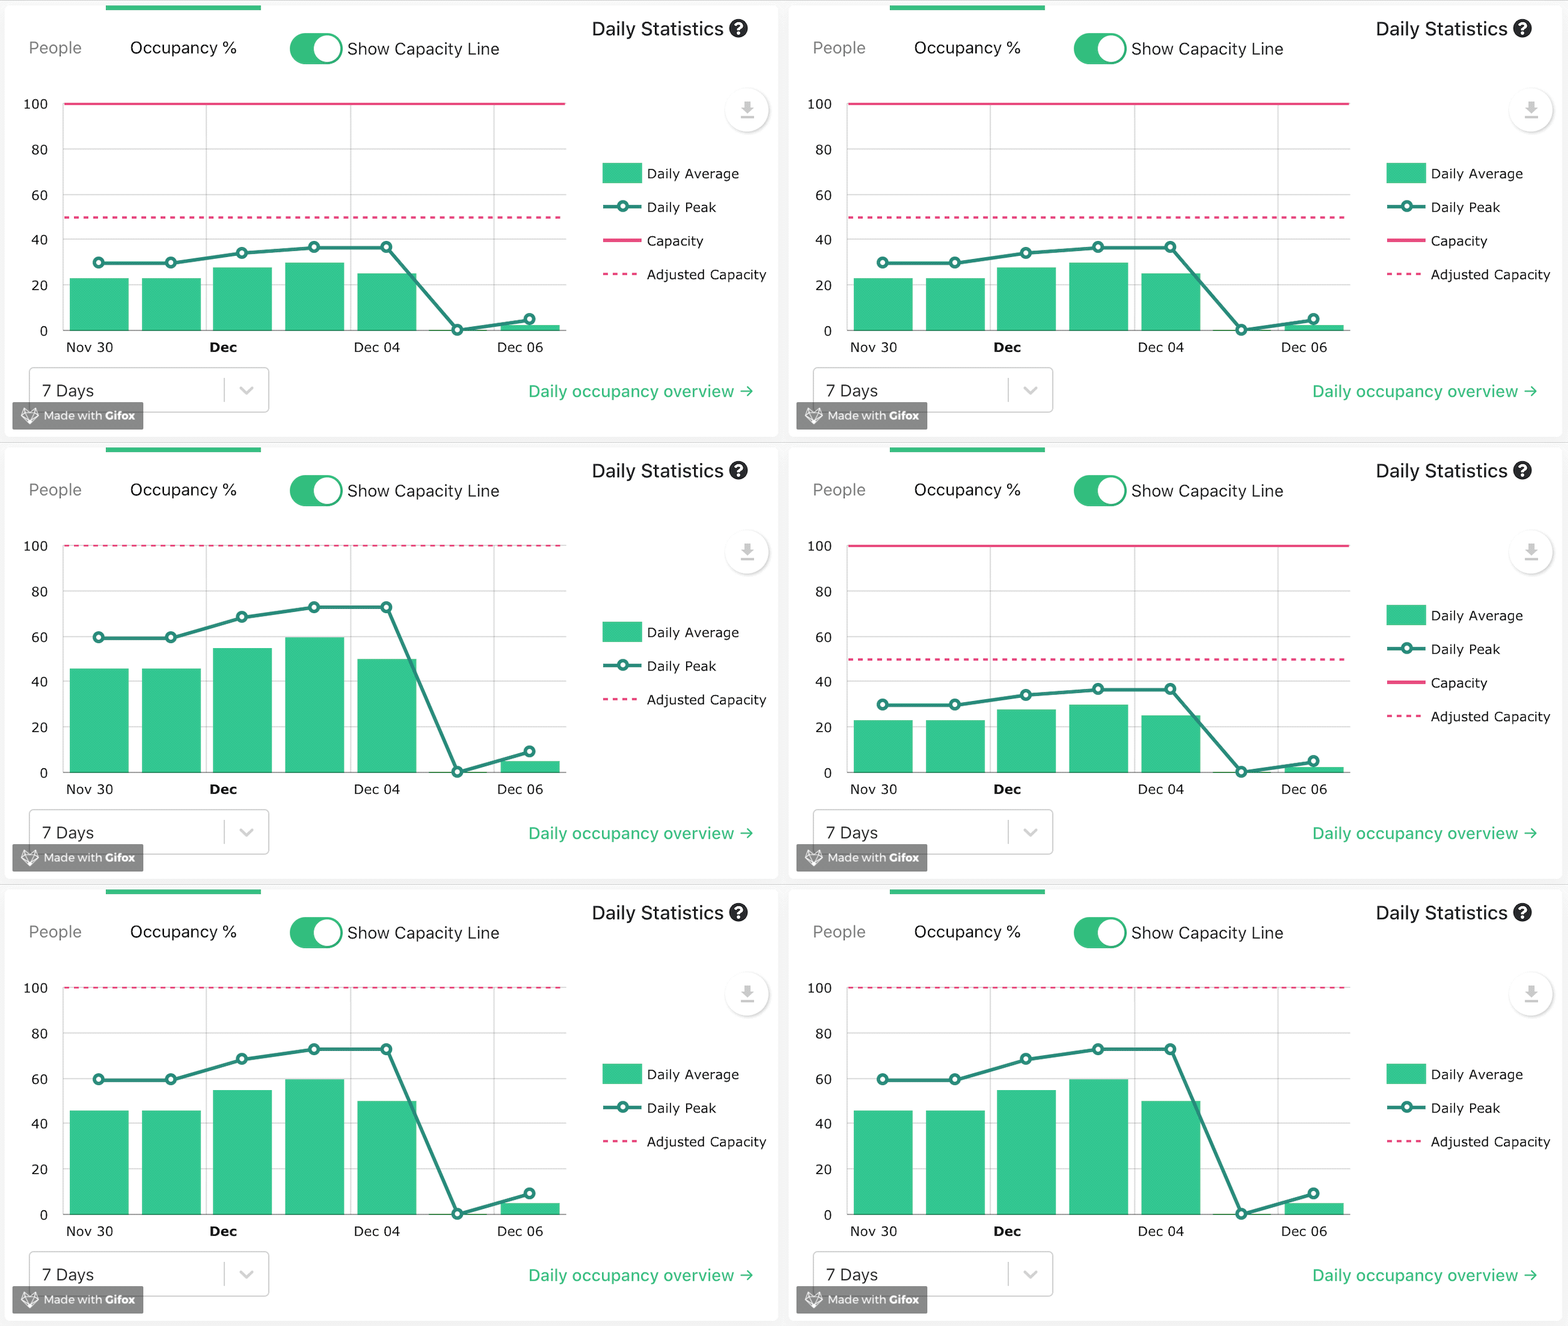
Average peak occupancy rates have flattened since the beginning of the year, with minimal fluctuation across North America (35%), APAC (34%), and Europe (33%) with dips only for holidays.
Consistent with last year, Latin America remains the region with the lowest occupancy rate at 21%.
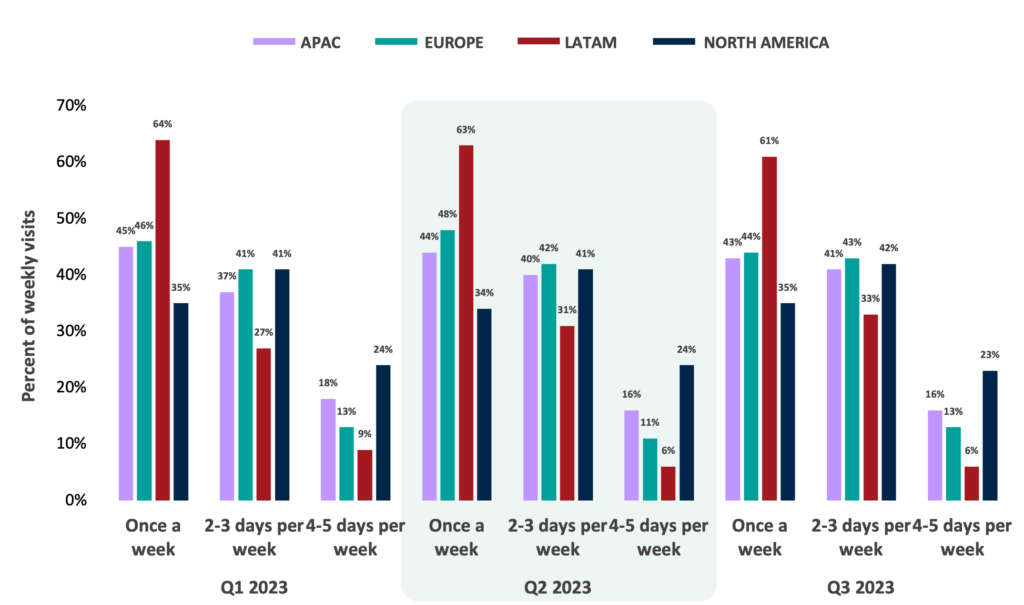
Office Visit Frequency Remains Highest in North America
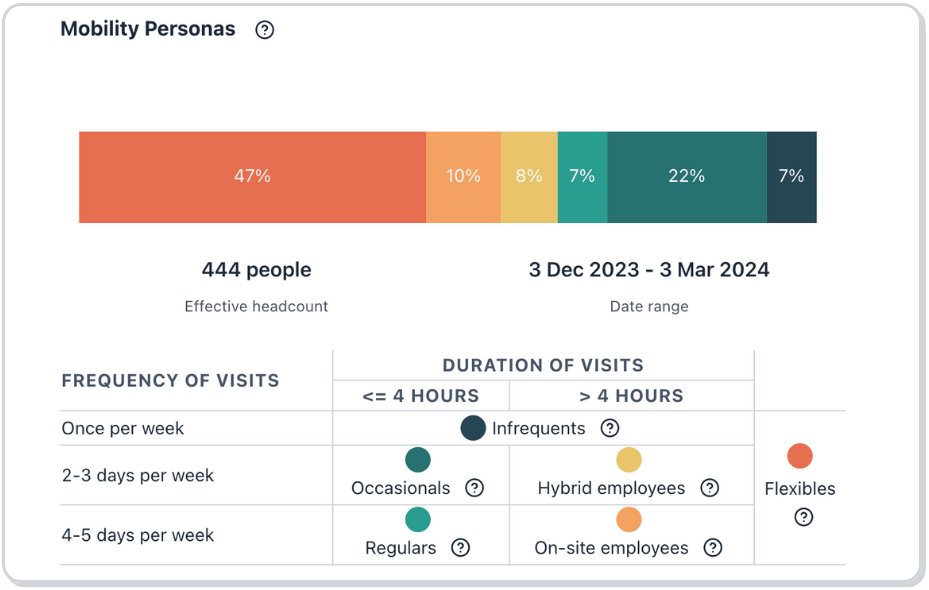
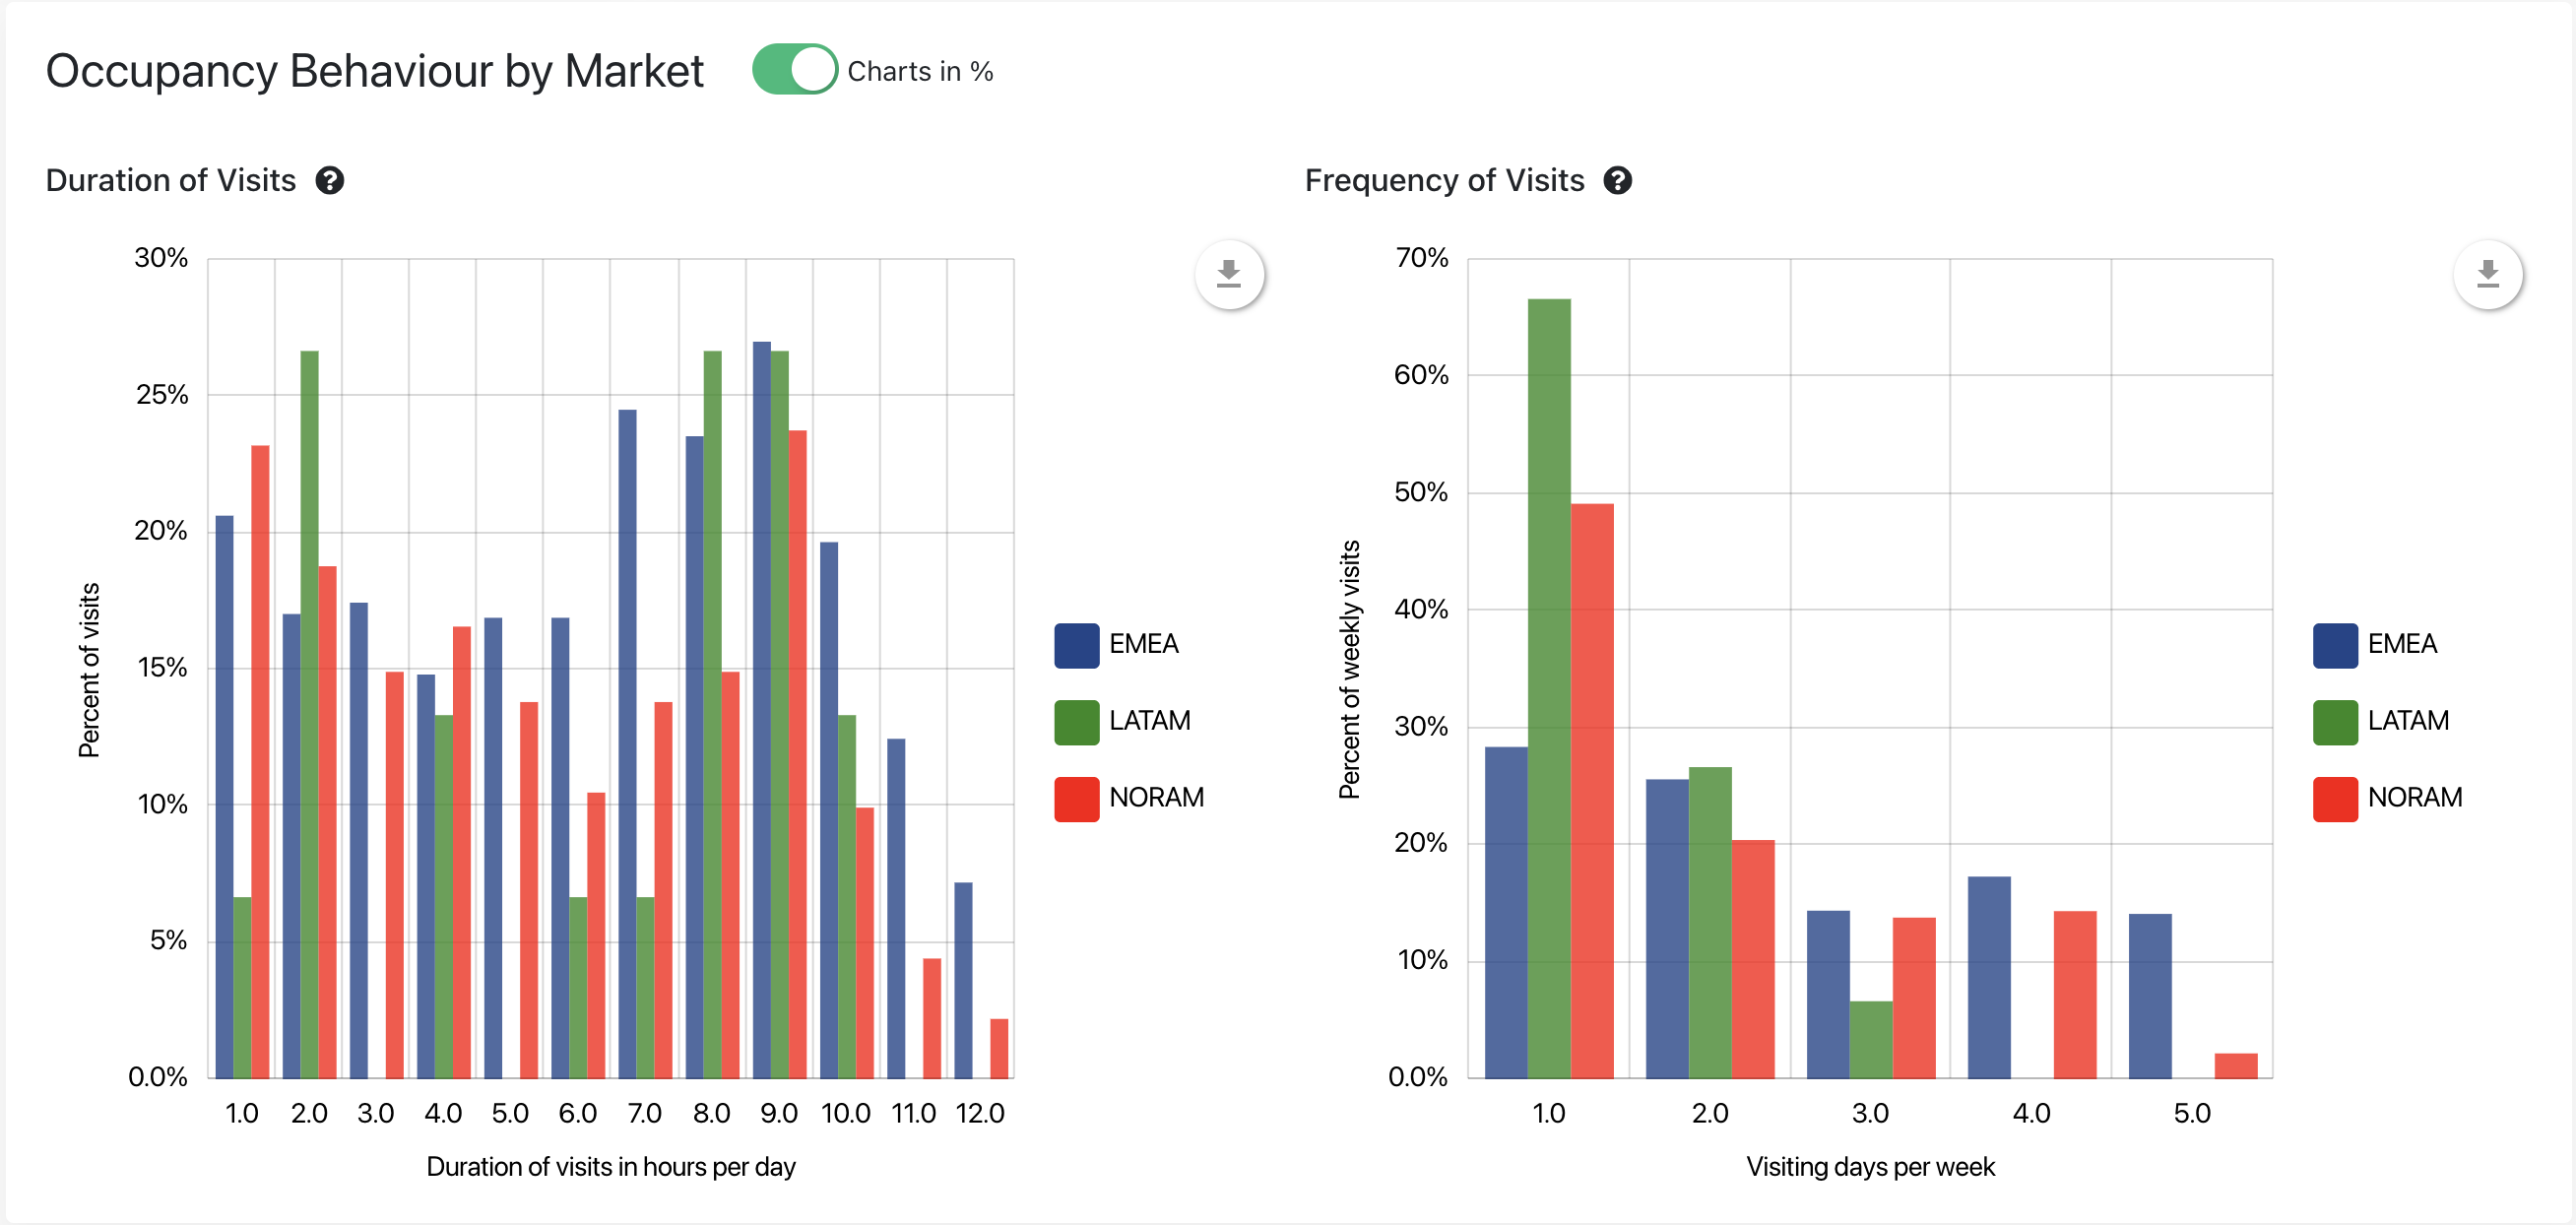
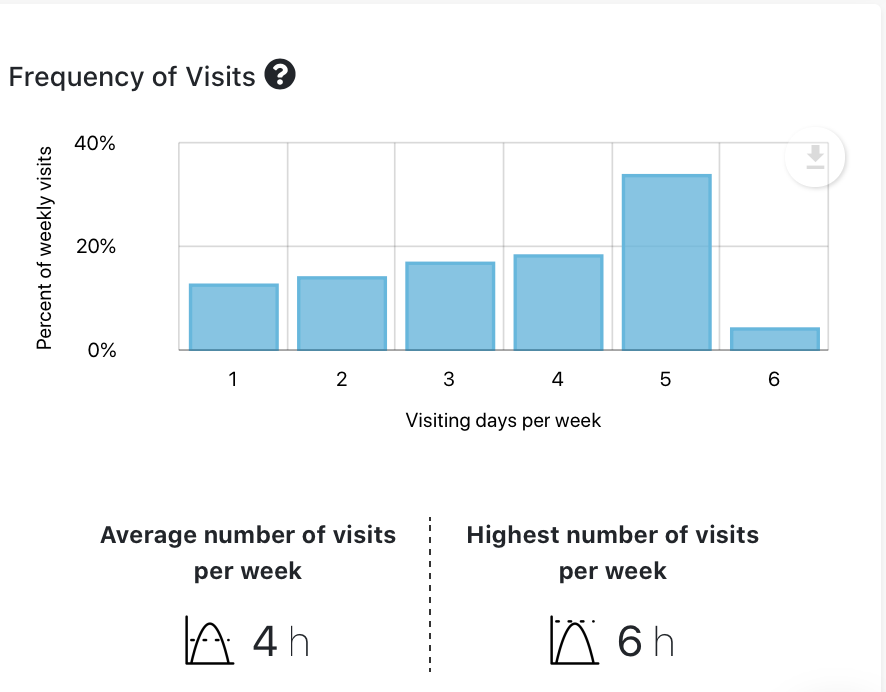
North America continues to exhibit the highest frequency of office visitors with 65% of weekly visits occurring on at least 2 days per week, surpassing other regions.
While LATAM has shown minor increases in 2-3 days per week, it maintains its unique frequency distribution with only 6% of visits occurring 4-5 days per week.
Occupational Variance Index (OVI) Reflects Need For Occupancy Optimization
LATAM recorded the increasingly highest OVI each quarter, demonstrating the potential for substantial optimization efforts. For APAC, a consistently low OVI averaging <20% indicates minimal effort in weekly occupancy management.
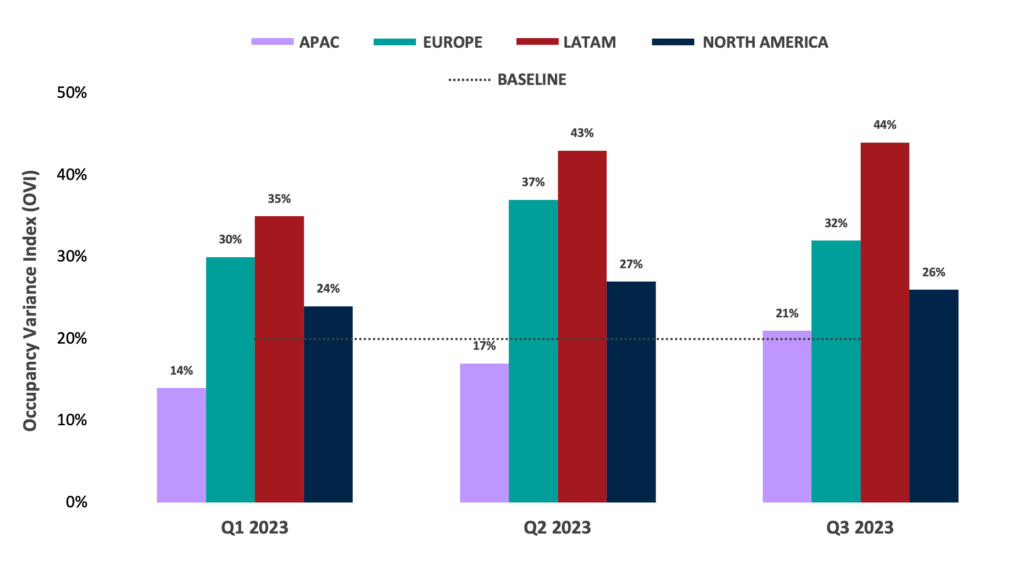
* The Occupancy Variance Index (OVI) offers valuable insights into the weekly distribution of office visits. It is calculated as the Standard Deviation of the Weekly Percentage of Visits divided by the Average Percentage of Visits. A high OVI indicates significant variability in occupancy throughout the week, while a low OVI suggests stability.
Long Duration Visits Declined by >17%
Long duration visits of 6 hours or more declined QoQ in all regions, with the highest decline in North America (19%) and followed closely by LATAM (18%), APAC and Europe (17%).
Check out the full Q3 Basking Global Occupancy Benchmarks Report to understand trends by region and explore strategic opportunities for empowering CRE success. For a deeper dive into the data and key insights, don’t miss our Q3 Benchmarks Webinar with Tiffany English, Senior Director of Architecture at Qualcomm.
Contact us to learn how we can help you achieve your end-of-year goals and plan for a successful 2024.


