Mastering the Future of Work: Data-Driven Return to Office Strategies


In today’s dynamic work environment, companies are navigating the delicate balance between the benefits of in-person collaboration and the newfound flexibility of remote work. While studies suggest that face-to-face interactions can boost team engagement and foster a strong corporate culture, the post-pandemic world has also highlighted the importance of offering employees the option to work from home. In response, the concept of hybrid work has gained prominence, with companies of all sizes and locations embracing it. As a result, many organizations are now adopting “Return to Office Goals” to establish a clear framework for in-office presence.
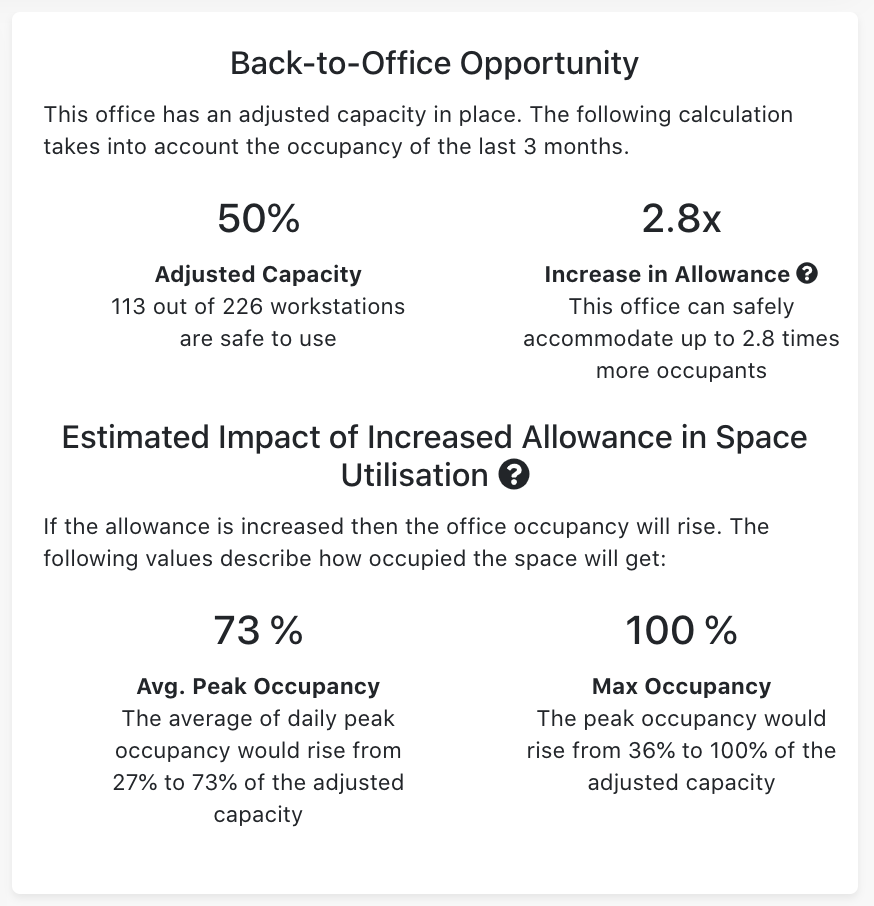
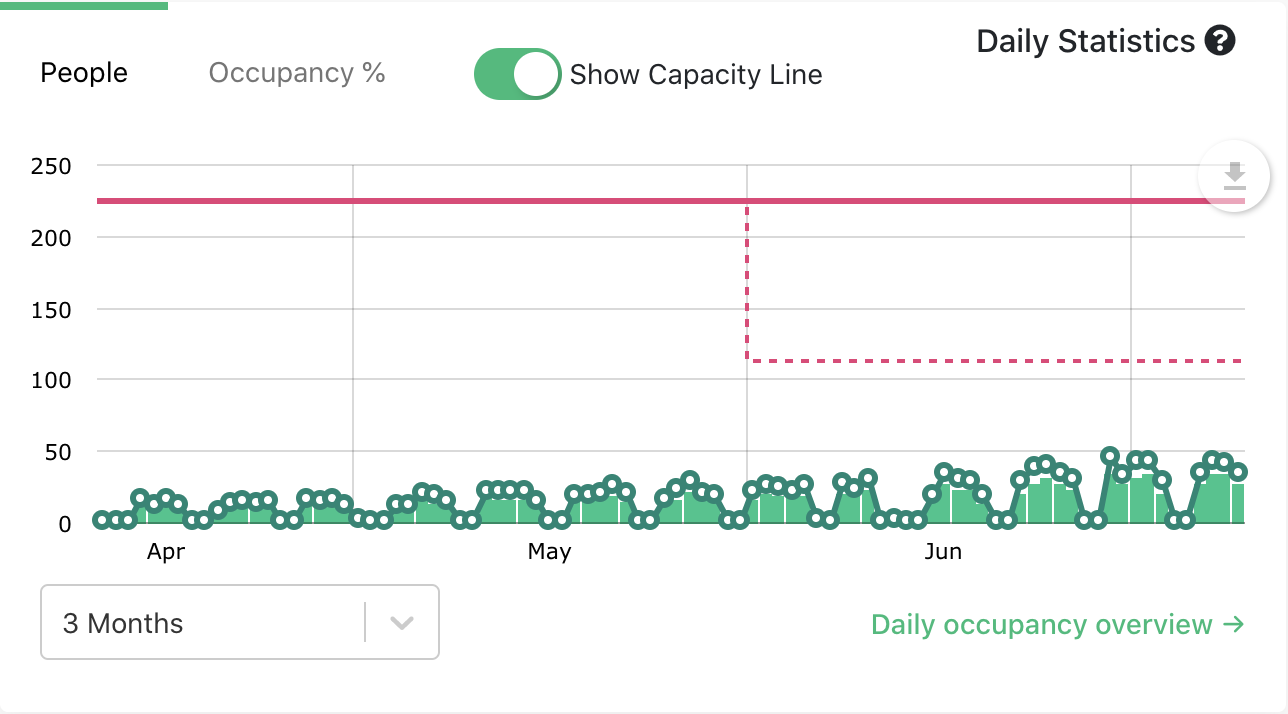
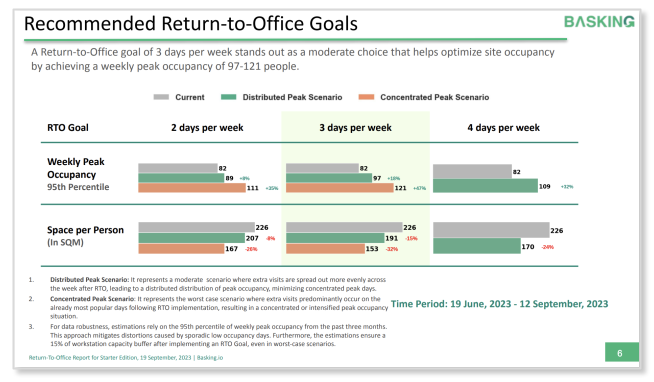
At Basking, we recognize the significance of data-driven decision-making when it comes to setting Return to Office (RTO) Goals. Rather than relying on anecdotal evidence, we’ve developed sophisticated algorithms to assist companies in this crucial endeavor. Our newly revamped “Return-to-Office” report is designed to provide tailored RTO Goals at the site level. Our simulations draw on historical trends from the past three months and ensure a 15% capacity buffer even in worst-case scenarios
Focus on RTO Alignment
The primary objective of this report is to empower real estate teams with the insights they need to assess their office space requirements in alignment with RTO Goals. We recognize that achieving this balance can be a complex task, and our report is here to assist you.
Our insights are derived from two distinct scenarios:
- Distributed Peak Scenario
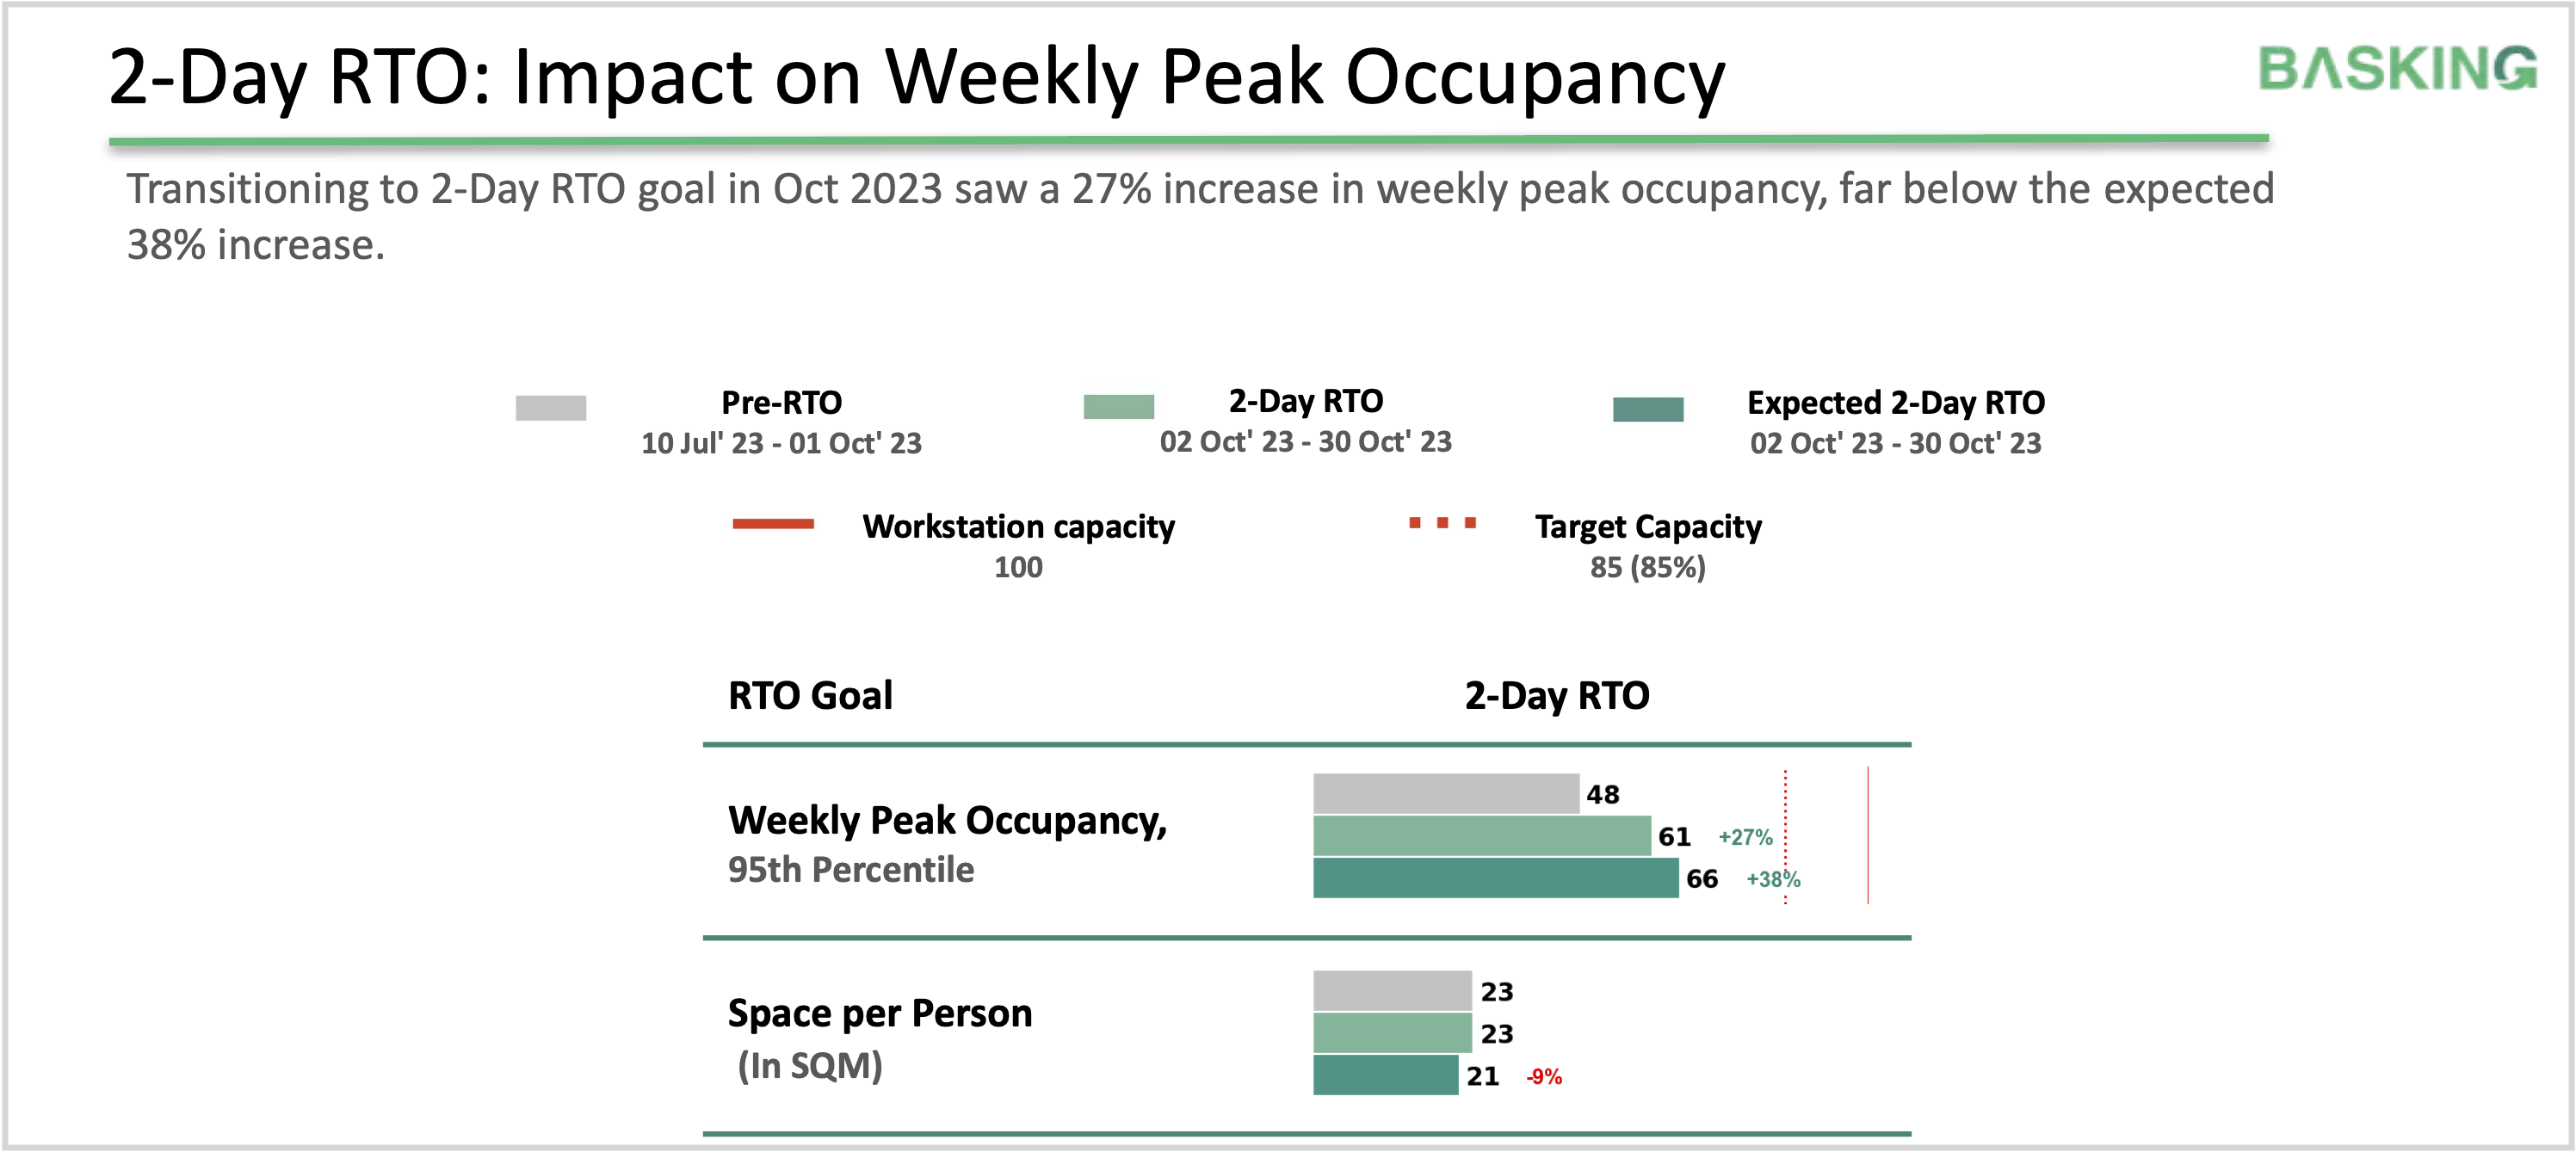
This represents a moderate scenario where additional office visits are evenly distributed throughout the week following the implementation of RTO. This approach minimizes concentrated peak occupancy, resulting in a more balanced work environment. - Concentrated Peak Scenario
This represents the worst-case scenario where extra visits predominantly occur on already popular days following RTO implementation. This scenario can lead to concentrated or intensified peak occupancy situations.
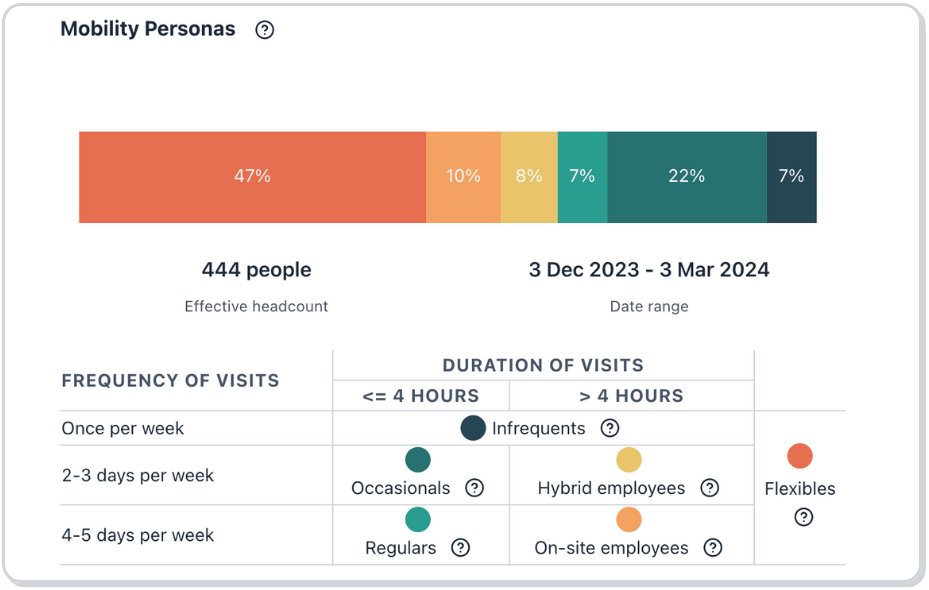
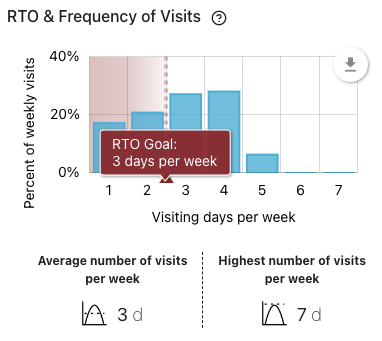
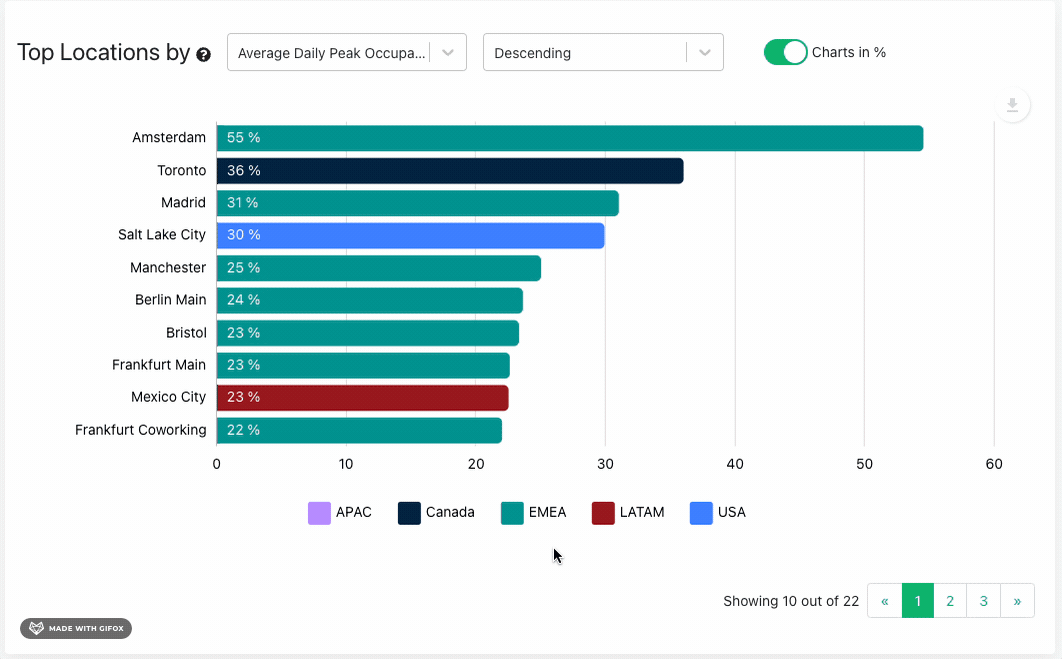
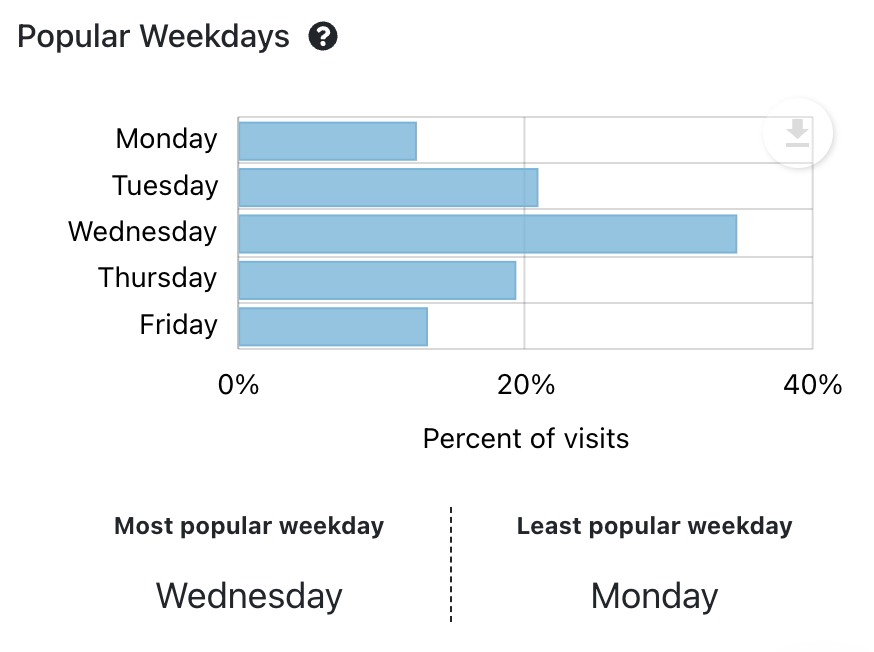
Understanding the Occupancy Variance Index (OVI)
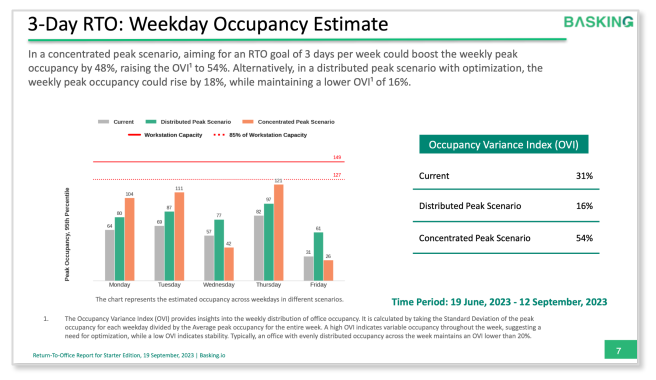
In addition to recommending RTO goals for each site, Basking also estimates the impact on weekday occupancies for both scenarios. This data empowers real estate teams with the information needed for a data-driven journey towards Corporate Real Estate (CRE) success.
When estimating weekday occupancy in different scenarios, our workplace management team provides access to the Occupancy Variance Index (OVI). The OVI offers valuable insights into the weekly distribution of office occupancy. It is calculated by taking the Standard Deviation of peak occupancy for each weekday and dividing it by the Average peak occupancy for the entire week. A high OVI suggests variable occupancy throughout the week, indicating a need for optimization, while a low OVI indicates stability. Typically, an office with evenly distributed occupancy across the week maintains an OVI lower than 20%.
This information equips you with the tools needed to make informed decisions about your site’s RTO strategy, ensuring you have a safety margin to accommodate unforeseen circumstances.
As companies embrace the evolving landscape of work arrangements, data-driven decision-making becomes paramount. With Basking’s “Return-to-Office” report, you gain the insights and confidence needed to navigate the Return to Office transition successfully and optimize your office space for the future of work.