The Basking Top 5: Counting Down Our Favorite Updates of 2023


Over the past year we have worked to ensure Basking remains the most accessible, impactful, and easy-to-use occupancy analytics tool available. While the changing nature of workplace optimization has brought challenges, we see opportunities to innovate and are thankful to partner with organizations that share our passion for better.
Of course, there’s more where that came from—we’re already excited for the new insights and opportunities 2024 will bring. In the meantime check out our biggest highlights from 2023 and we wish you a restful holidays and happy new year from the Basking team!

RTO Reporting
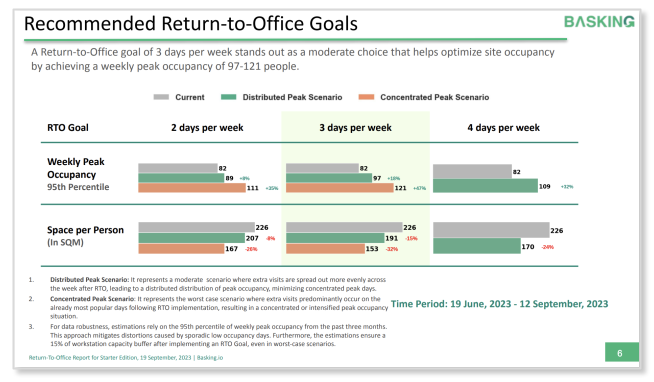
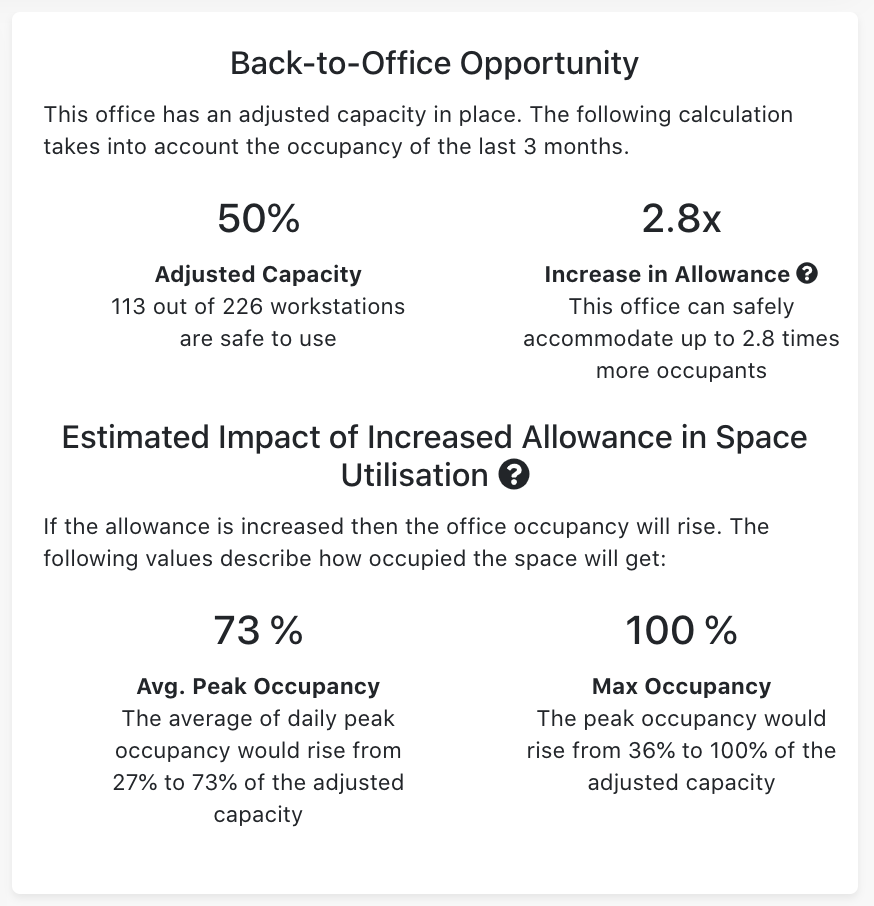
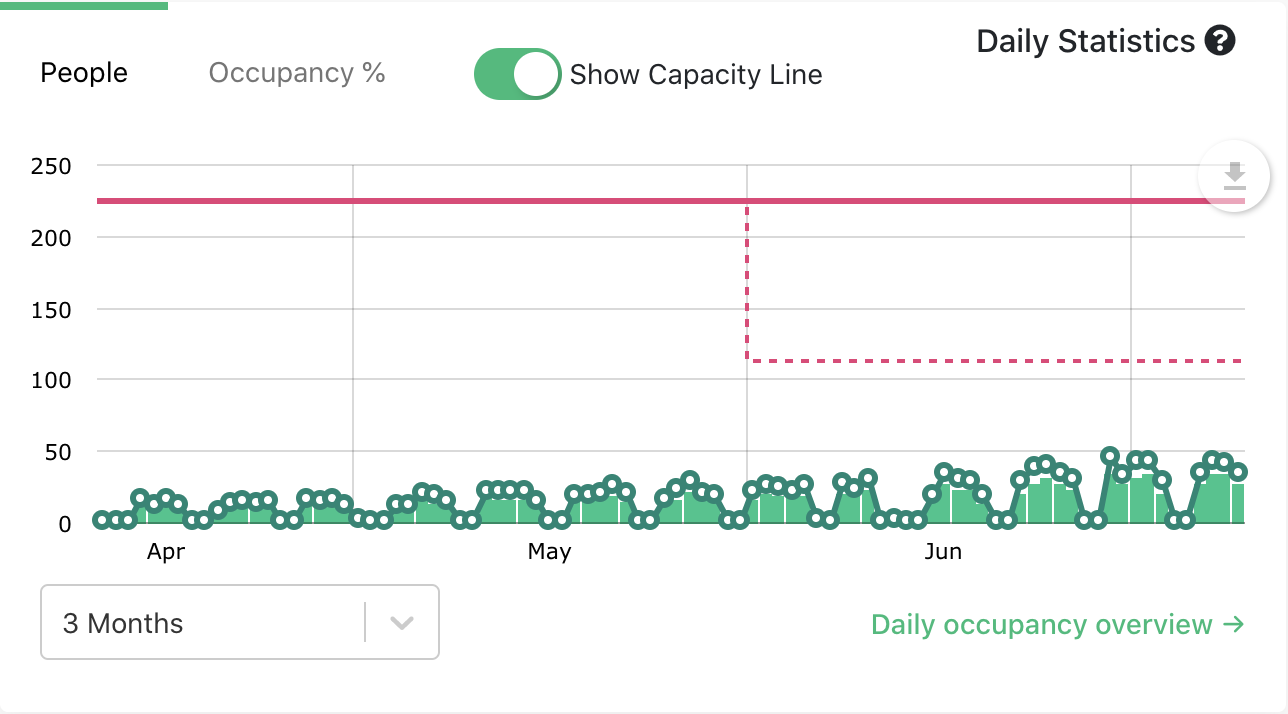
Top of mind this year for many companies was developing and evolving their Return to Office strategies. Basking introduced RTO-specific reporting capabilities to provide real-time insights, enabling you to see the policy impacts on a site’s performance and utilization throughout the process:
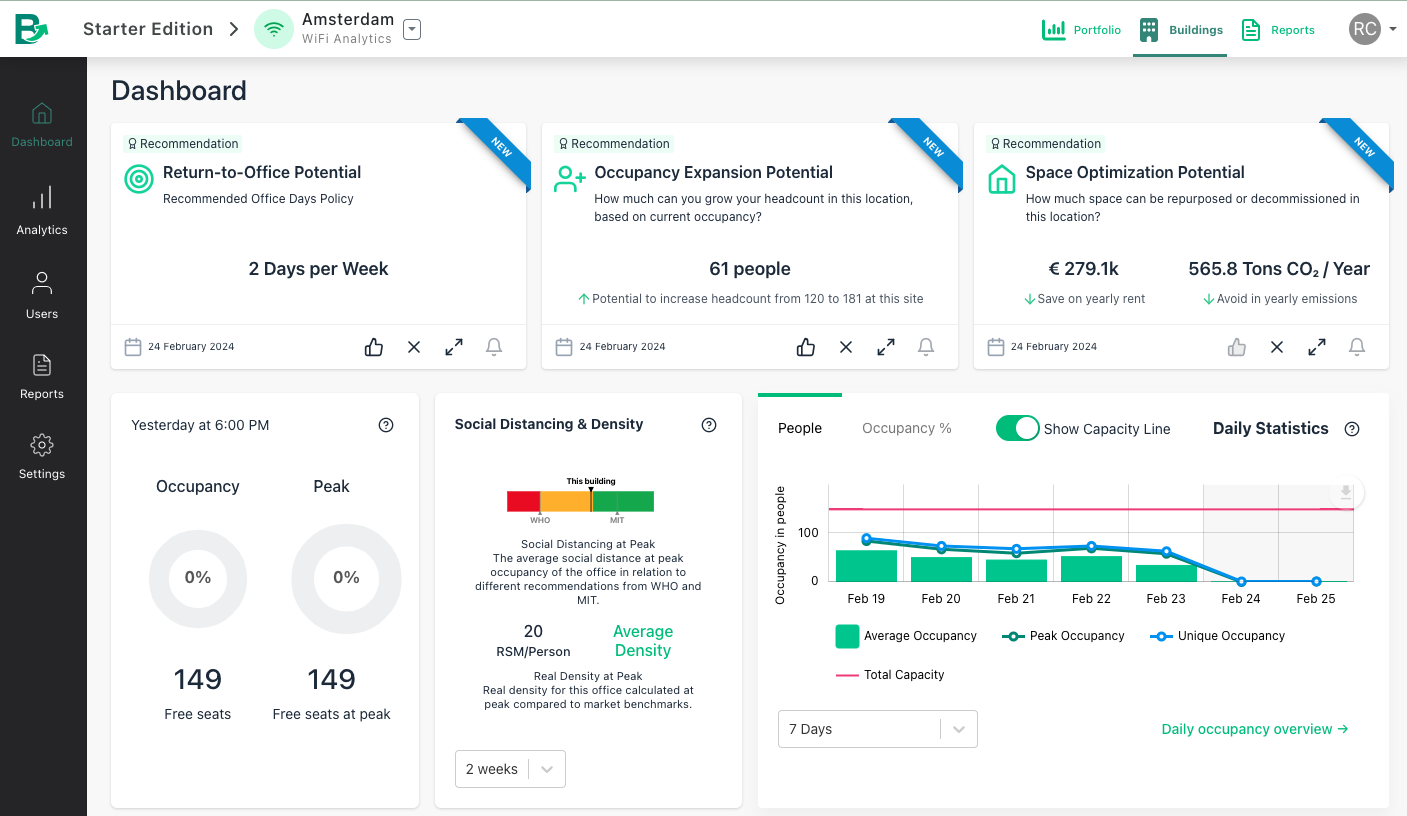
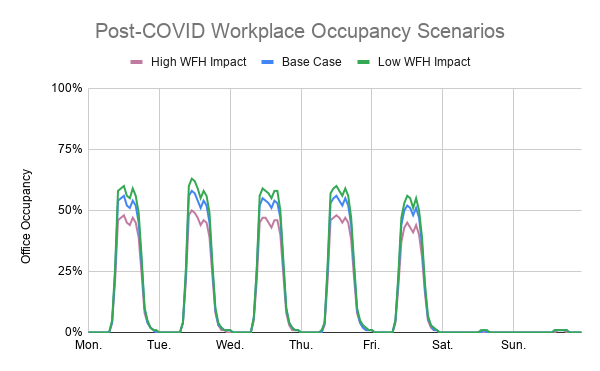
- Run projections – with automatically generated scenario analysis in RTO Goal Analysis
- Formulate policy – with simulations drawing on your historical trends and accounting for capacity buffers, as well as site-specific recommendations to facilitate appropriate goals and timelines
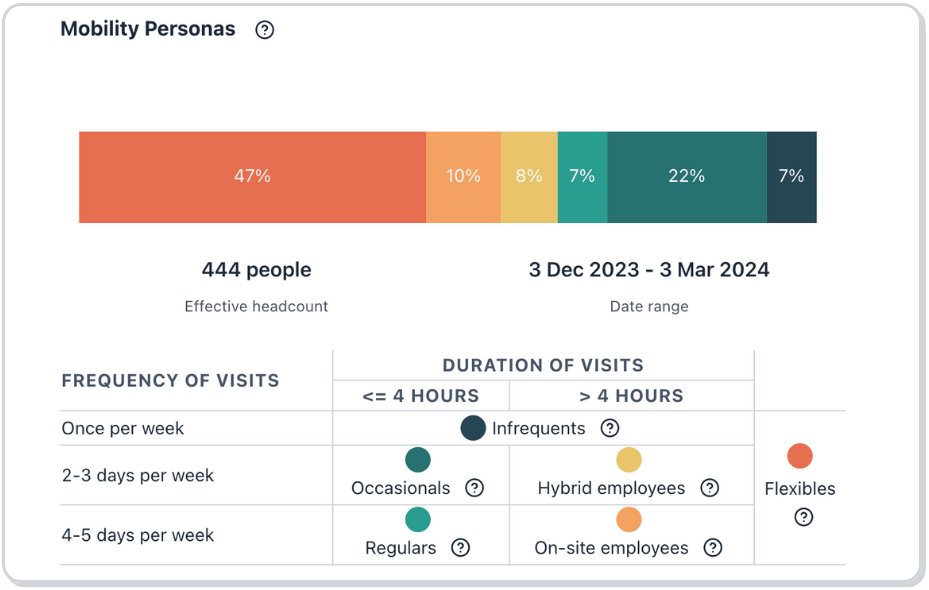
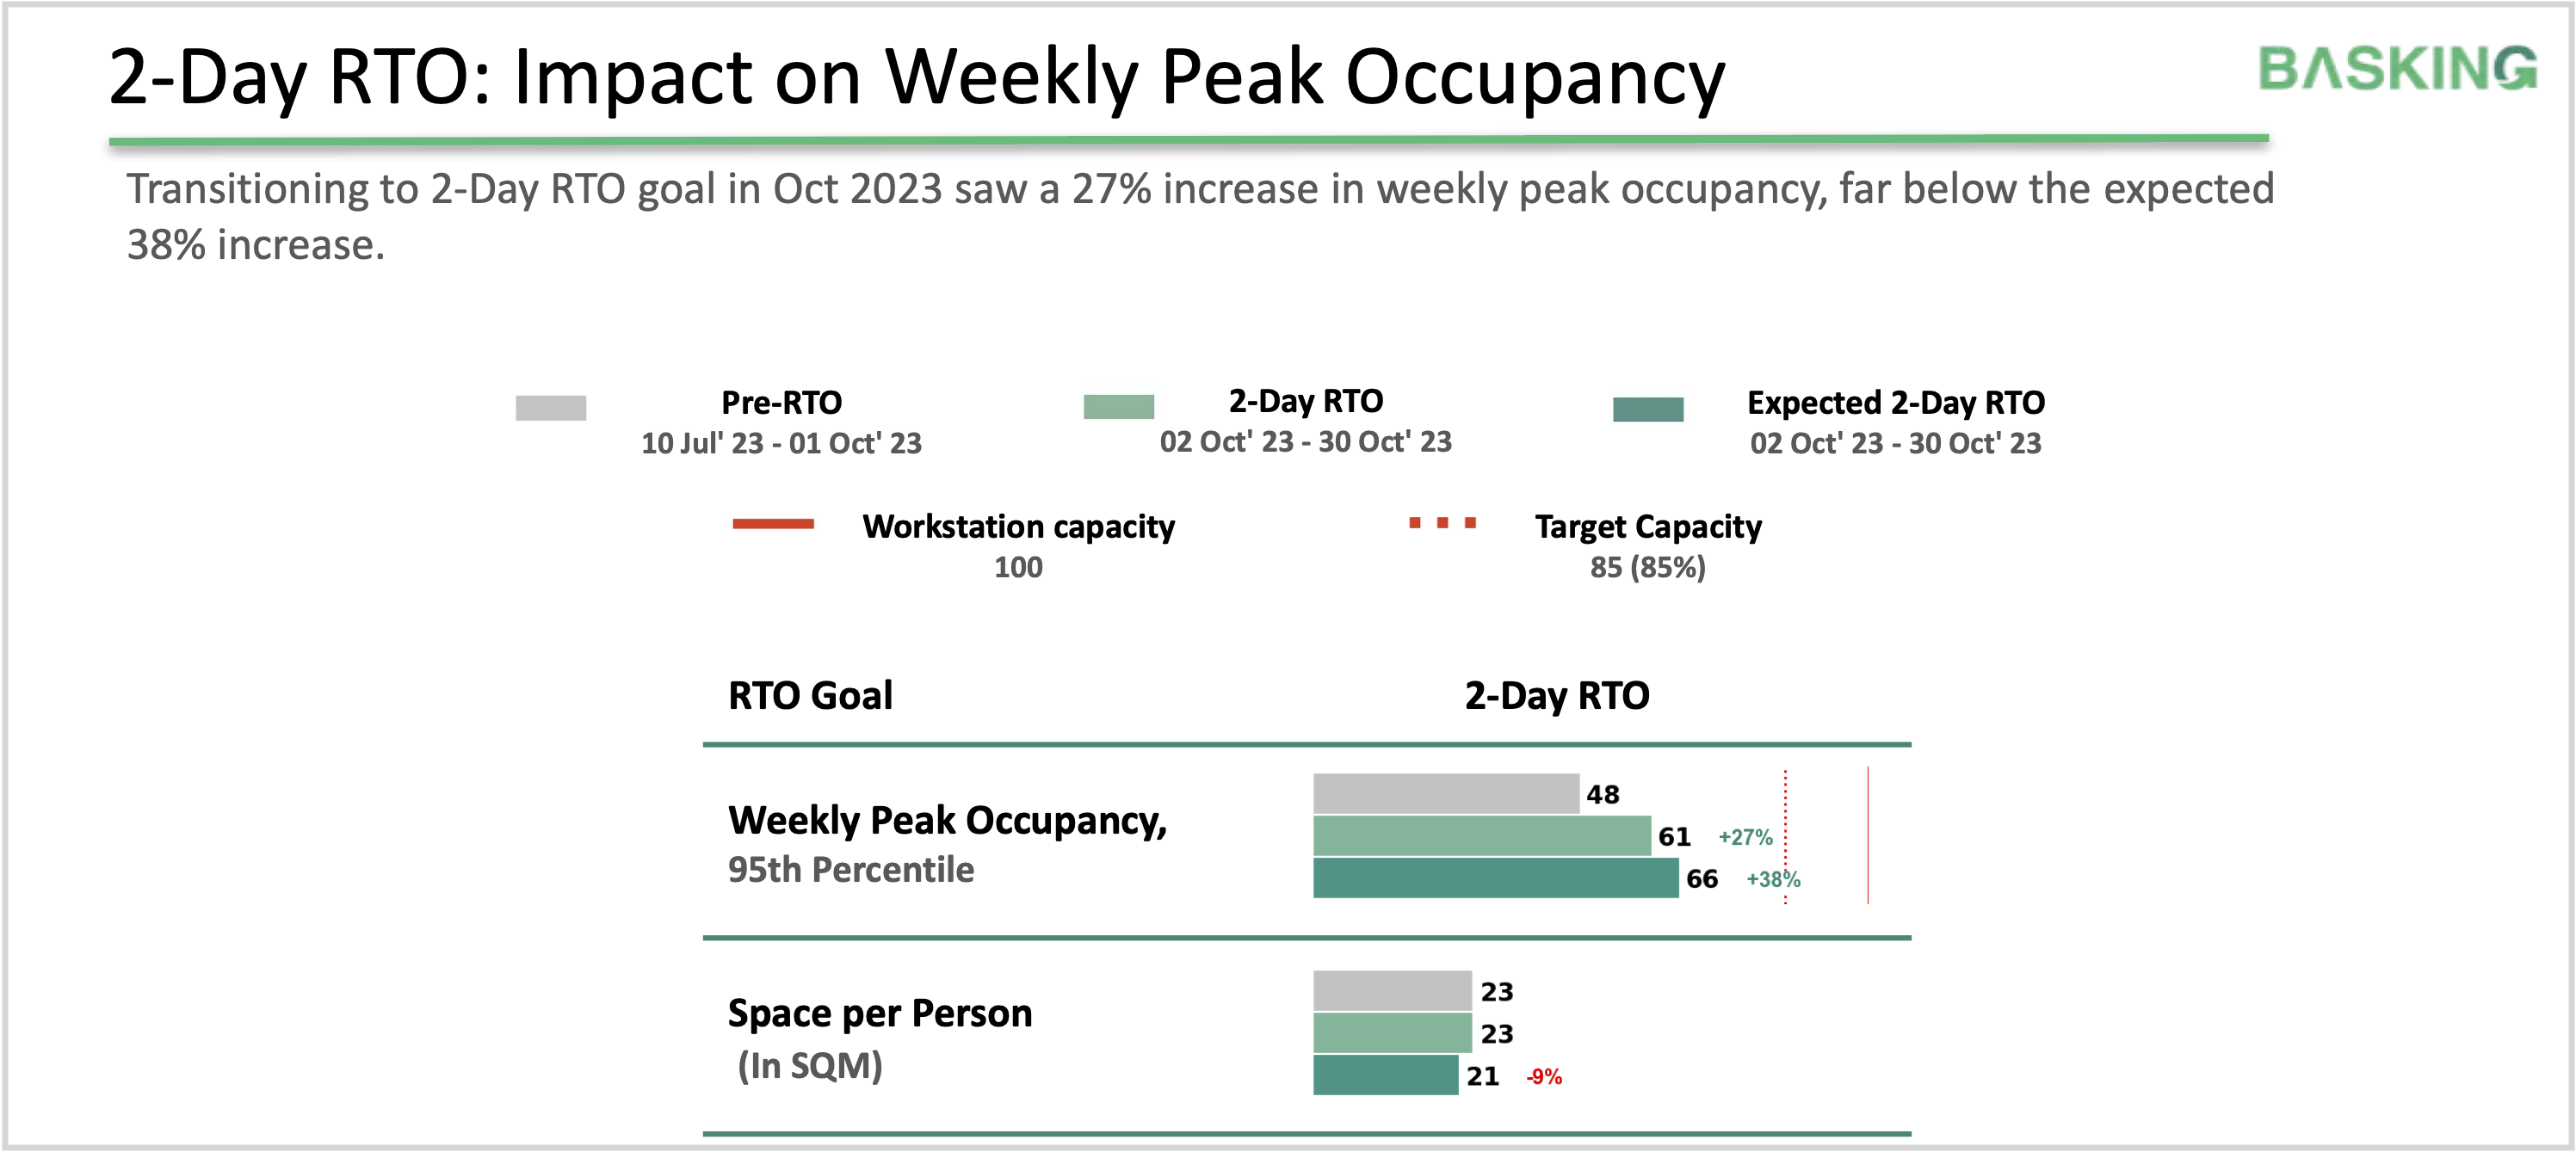
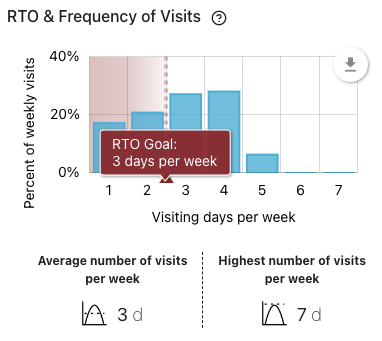
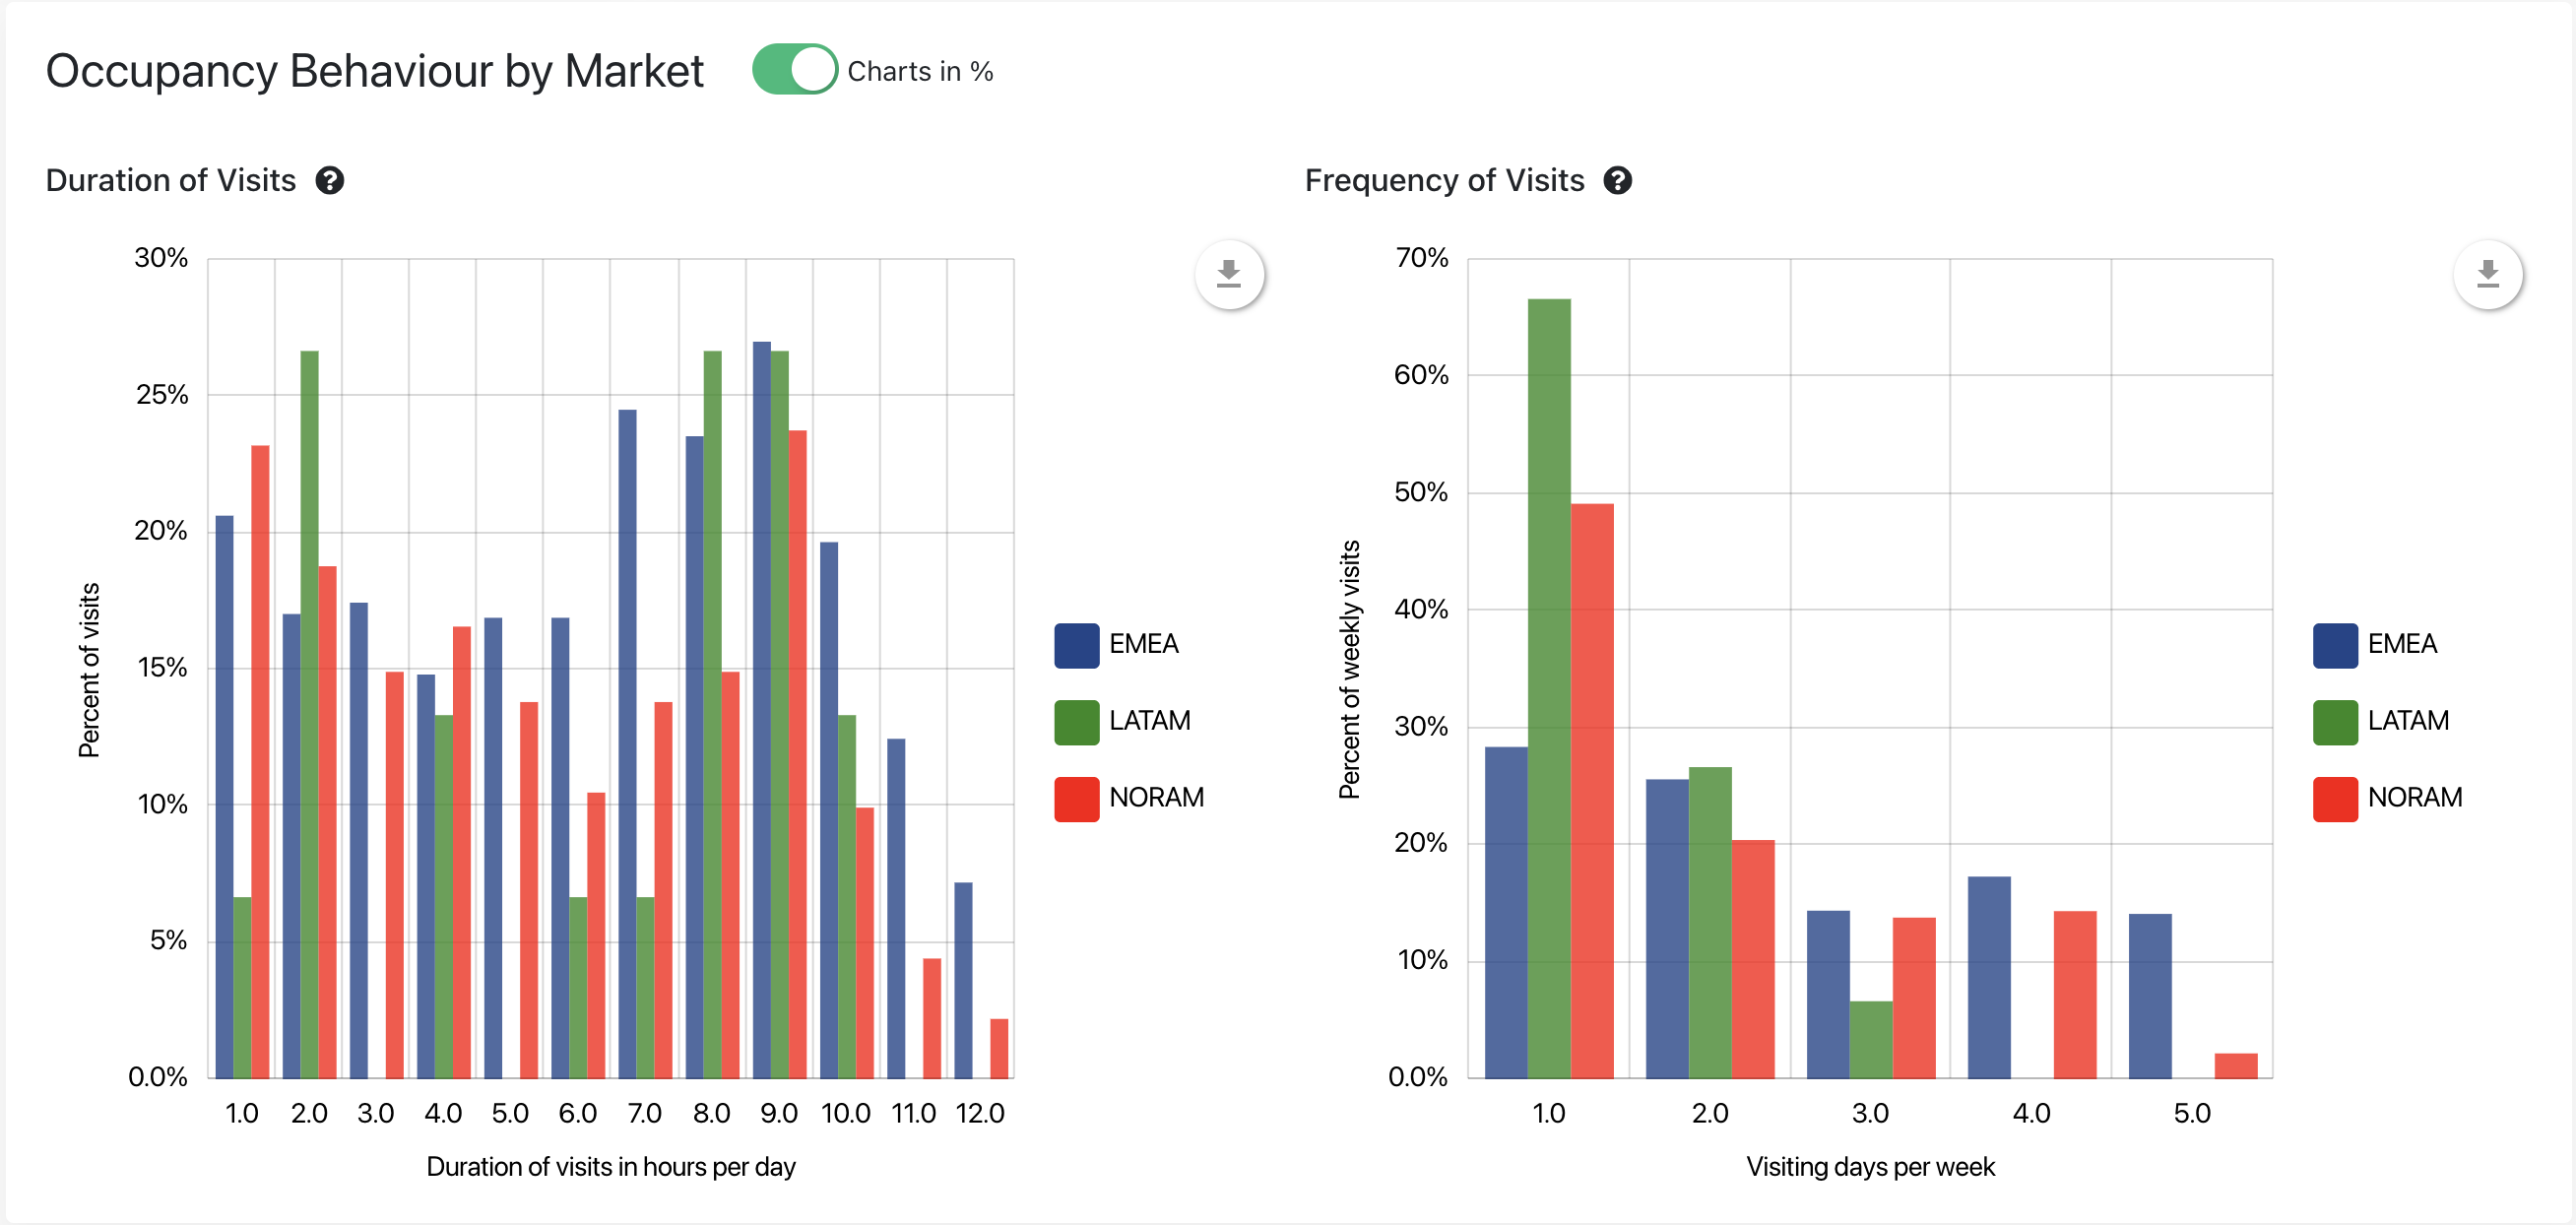
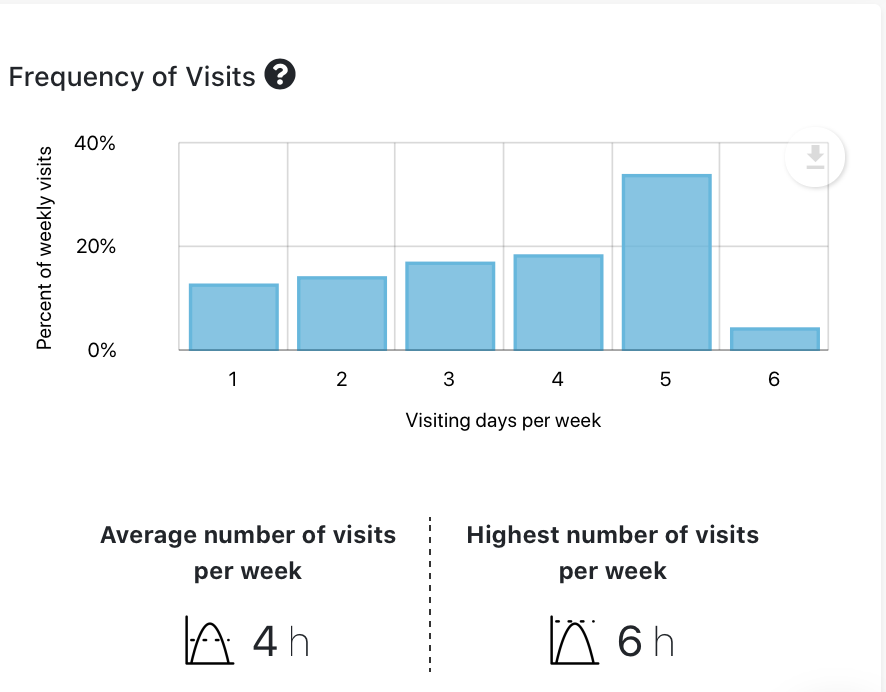
- Assess impact – with site-level data to understand adherence and impact on space utilization, including optimization across frequency and duration of visits

Portfolio Management Report
The new Portfolio Management report serves to answer the question, where is my greatest potential for optimization? With a comprehensive overview of office utilization trends across various regions in your portfolio, you can readily identify the top most used or unutilized locations at a glance:
- Maximize underutilized sites — opportunity for consolidation, growth, back-to-office, lease negotiation, or even exiting the site
- Manage highly utilized sites — opportunity for flexible workplace, occupancy distribution incentives, lease extension, or expansion of space

Behind-the-Scenes
Of course, some of the best updates are the ones you don’t see. The flexibility of infrastructure-as-a-sensor combined with our commitment to efficiency and security means we are always looking for new integrations and rethinking existing processes to better harness the available data.
- Pre-mapped Integrations for PIR, Thermal Image, and Barrier Count sensors maximize those legacy data sources in a meaningful and accessible way
- Expedited integration for Juniper Mist WiFi networks, which now takes less time than making your New Year’s Resolutions
- Reorganized Portfolio views to focus on important KPIs and play well with IWMS or PowerBI systems
We were also proud to announce our SOC 2 Type 2 certification, a reflection of the hard work of the whole Basking team and our ongoing commitment to the highest standards of security and compliance.

Sustainability
Basking was founded with a focus on environmental protection and sustainability, and this drives our efforts to maximize utilization opportunities within the built environment. Our new dedicated potential CO2 emission savings estimate helps organizations define, track, and report on their own commitments to sustainability for a variety of audiences and expectations.
Built into the dashboard, this tool highlights real estate underutilization at both the site and portfolio level and can be used to assess the ESG potential from real estate optimization measures.

Analytics
As office utilization continues to evolve, flexibility and specificity are more important for workplace management than ever. And just like you, we are always looking at how we can better calculate occupancy metrics. From refining our algorithms to creating new ways to parse your data, our analytics updates offer even more flexibility to tailor your reporting and support your business goals.
- Redefining capacity: In addition to workstation capacity, the platform now supports total seat capacity for tracking occupancy.
- Breaking the monolith: The new business unit space analysis report highlights site utilization and usage patterns broken down by business units.
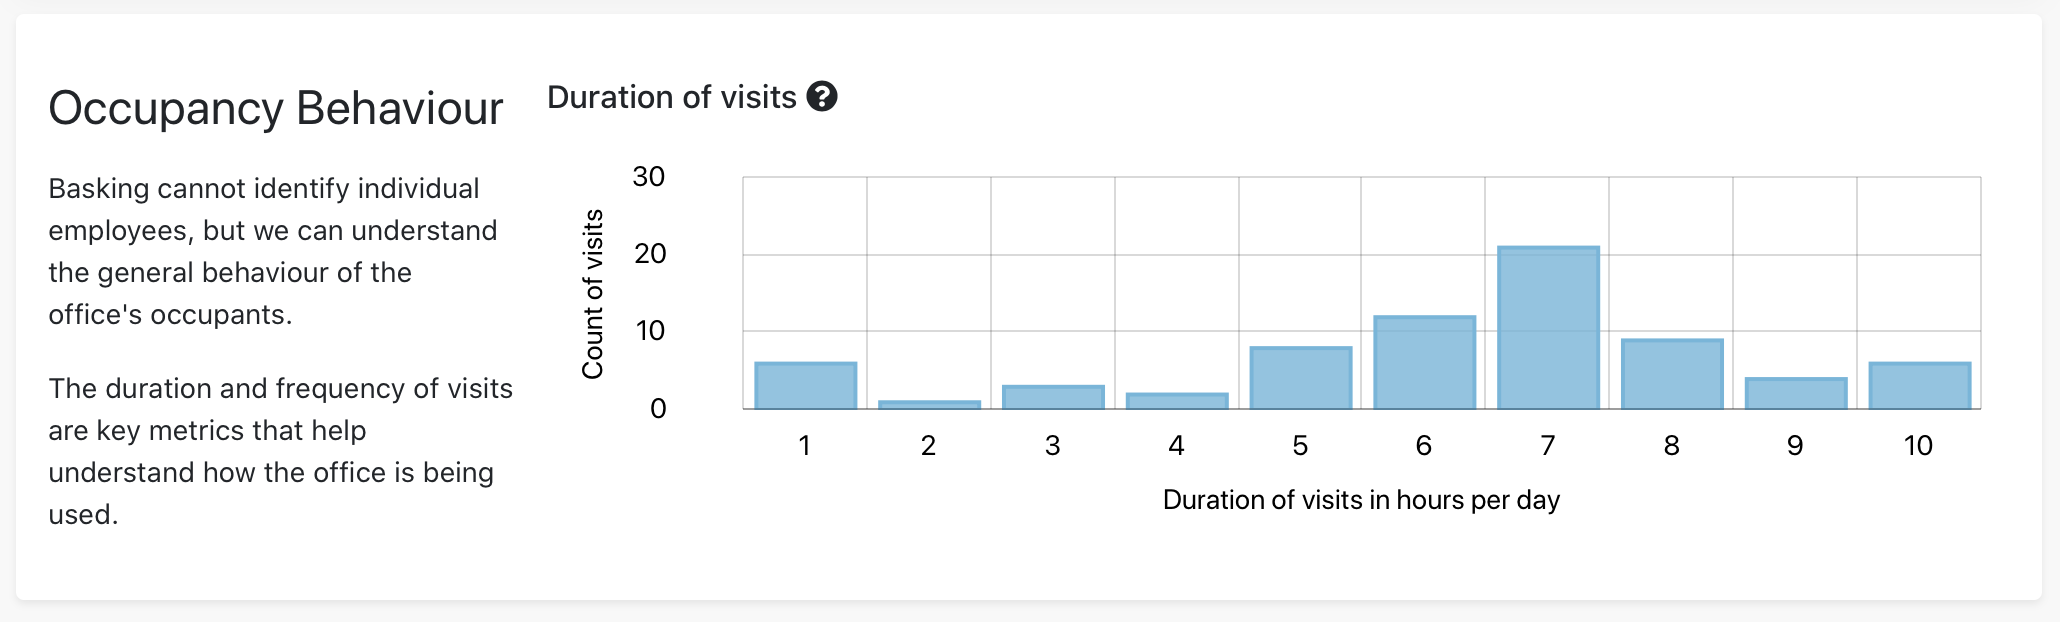
- Broadening the dataset: A new calculation for duration of visits reflects the time in smaller increments to reduce the skewing effect, giving you more specificity and complete confidence in the accuracy of your data analysis.
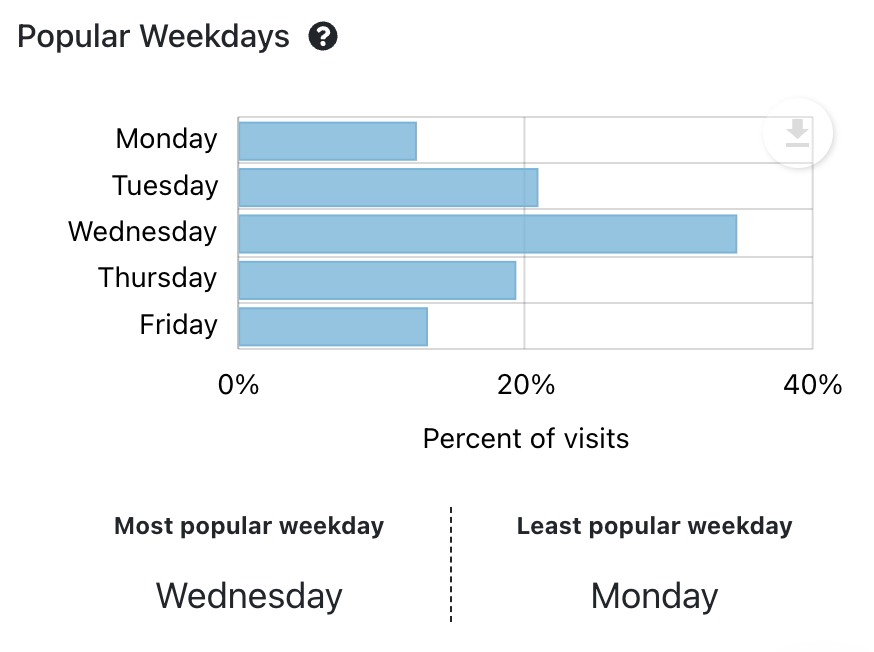
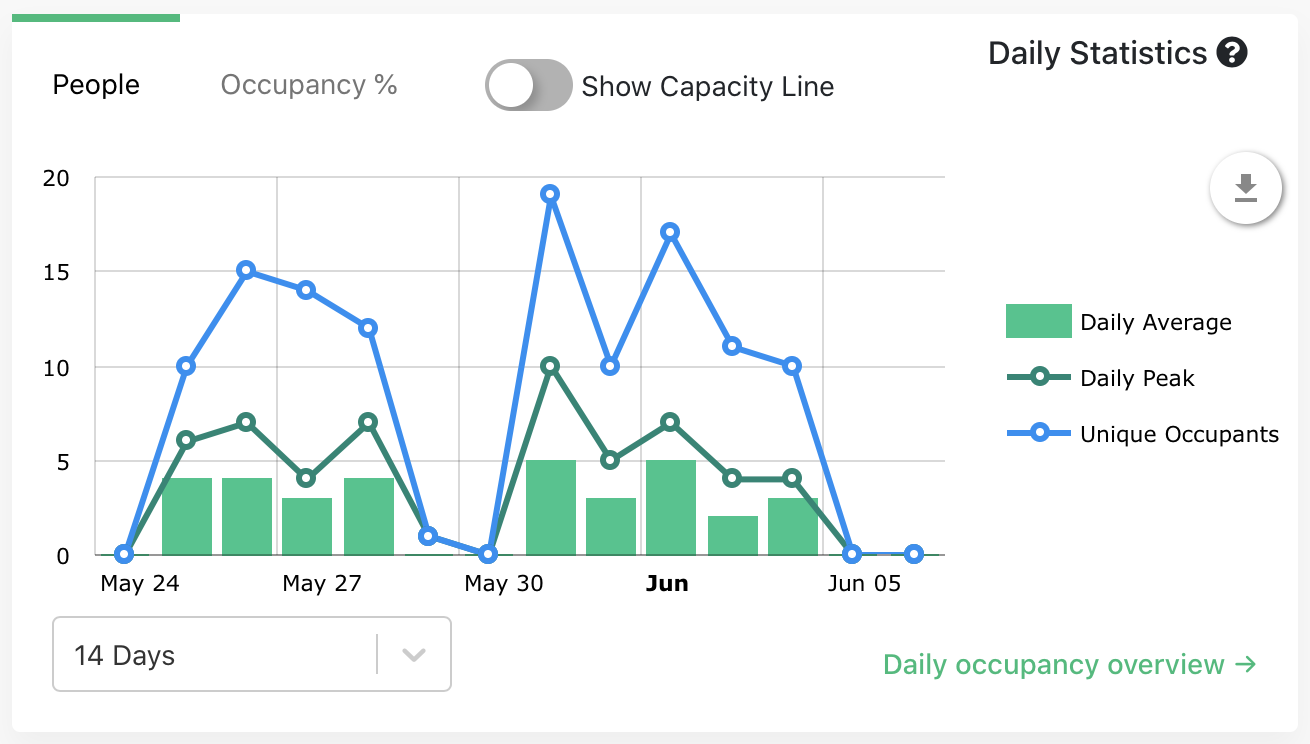
And when we realized that there wasn’t a good way to reflect the occupancy disparities across weekdays, we created a new metric—the Occupancy Variance Index (OVI). Calculated as the Standard Deviation of Weekday Occupancy/Average occupancy across the week, OVI originated because we saw the majority of people choosing already popular weekdays for their 2-3 days in office. By quantifying occupancy management efficiency across different workdays, OVI becomes an indispensable tool in adapting to the fluid nature of modern workspaces.